Page 176 - Power Quality in Electrical Systems
P. 176

158   Chapter Eleven


           500%

           400%


                                          CBEMA
           300%                           ITIC
          Voltage                         SEMI F-47
           200%
                              130%
            140%
            120%                                 110%
                                                     106%
           100%                                      90%
                                                 87%
                           58%        70%   80%
            50%
                           30%
                                   0.2%
             0%
                 0.001  0.01  0.1  10 100  1000 Cycles
                        1 ms  1/2 50 ms
                Time      3 ms 8.33 ms  0.5  2  10  Seconds
                                20 ms
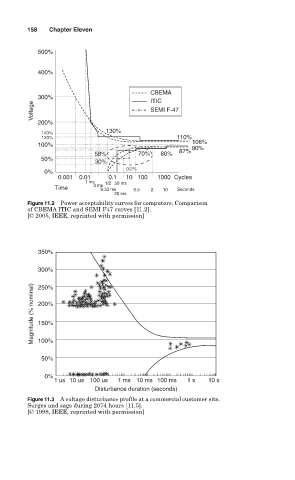
        Figure 11.2 Power acceptability curves for computers. Comparison
        of CBEMA ITIC and SEMI F47 curves [11.2].
        [© 2005, IEEE, reprinted with permission]

           350%

           300%

          Magnitude (% nominal)  200%
           250%


           150%

           100%

            50%

             0%
                1 us 10 us 100 us  1 ms 10 ms 100 ms  1 s  10 s
                           Disturbance duration (seconds)
        Figure 11.3 A voltage disturbance profile at a commercial customer site.
        Surges and sags during 2074 hours [11.5].
        [© 1998, IEEE, reprinted with permission]
   171   172   173   174   175   176   177   178   179   180   181