
Page 83 - Power Quality in Electrical Systems
P. 83
66 Chapter Five
vload+
D1 D2
vin+ C BUS
1000uF
I L
v s
vin−
5A
D3 D4
vload−
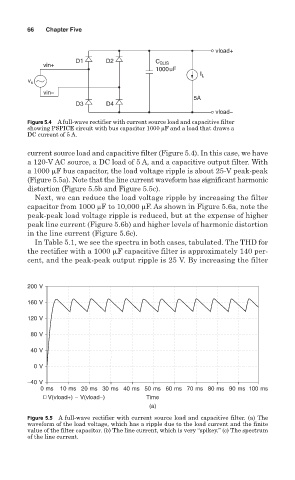
Figure 5.4 A full-wave rectifier with current source load and capacitive filter
showing PSPICE circuit with bus capacitor 1000 µF and a load that draws a
DC current of 5 A.
current source load and capacitive filter (Figure 5.4). In this case, we have
a 120-V AC source, a DC load of 5 A, and a capacitive output filter. With
a 1000
F bus capacitor, the load voltage ripple is about 25-V peak-peak
(Figure 5.5a). Note that the line current waveform has significant harmonic
distortion (Figure 5.5b and Figure 5.5c).
Next, we can reduce the load voltage ripple by increasing the filter
capacitor from 1000 µF to 10,000 µF. As shown in Figure 5.6a, note the
peak-peak load voltage ripple is reduced, but at the expense of higher
peak line current (Figure 5.6b) and higher levels of harmonic distortion
in the line current (Figure 5.6c).
In Table 5.1, we see the spectra in both cases, tabulated. The THD for
the rectifier with a 1000
F capacitive filter is approximately 140 per-
cent, and the peak-peak output ripple is 25 V. By increasing the filter
200 V
160 V
120 V
80 V
40 V
0 V
−40 V
0 ms 10 ms 20 ms 30 ms 40 ms 50 ms 60 ms 70 ms 80 ms 90 ms 100 ms
V(vload+) − V(vload−) Time
(a)
Figure 5.5 A full-wave rectifier with current source load and capacitive filter. (a) The
waveform of the load voltage, which has a ripple due to the load current and the finite
value of the filter capacitor. (b) The line current, which is very “spikey.” (c) The spectrum
of the line current.