
Page 47 - Practical Control Engineering a Guide for Engineers, Managers, and Practitioners
P. 47
22 Chapter Two
Where to Start?
This is a tough question. Sometimes it is best to start near the product
end of the process and work back upstream, especially if analysis
suggests that the local variance seems to be coming from the upstream
modules. Alternatively, one might start at the most upstream module
and work down. In this case the impact of solving problems in an
upstream module may not be discernible in the downstream mod-
ules because there has been no previous reference point. Finally, it
may make sense to start where the hands-on process operators think
the most problems are. It's always good practice to include the hands-
on process operators in the strategy development, the data review,
and the problem-solving activities.
Massive Cross Correlation
Before moving on with the road map, we should make a few comments
about an alternative complementary and popular approach to process
problem solving-the "product correlation approach." Here one cross-
correlates the end-of-line performance characteristics with parameters at
any and all points upstream in an attempt to find some process variable
that might be associated with the undesirable variations in the product.
This can be a massive effort and it can be successful. However, I have
frequently found that plant noise and unmeasured disturbances through-
out the process and its environment will corrupt the correlation calcula-
tions and generate many "wild goose chases." Often an analyst will
stumble across two variables, located at significantly different points in
the process, that, when graphed, appear to move together suggesting a
cause and effect. Unfortunately, in a complex process there are almost
always going to be variables that move together for short periods of time
and that have absolutely no causal relationship.
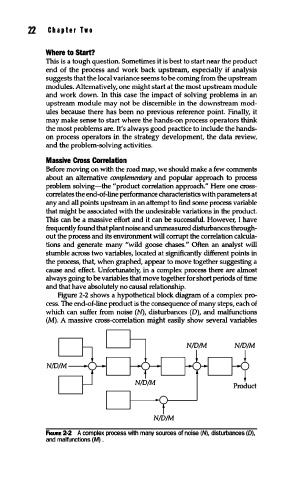
Figure 2-2 shows a hypothetical block diagram of a complex pro-
cess. The end-of-line product is the consequence of many steps, each of
which can suffer from noise (N), disturbances (D), and malfunctions
(M). A massive cross-correlation might easily show several variables
N/D/M
fiGuRE 2-2 A complex process with many sources of noise (N), disturbances (D),
and malfunctions (M) .