
Page 72 - Practical Control Engineering a Guide for Engineers, Managers, and Practitioners
P. 72
Basic Concepts in Process Analysis 47
1.4 r-----r---~---~-----r----r----....,
1.2 . . . .
1 .................................
0
I
I
0
.....................................
0
0
•
0
::::3 0.8
0 I I 0
0.6 • • 0 ••• ••••••• ••• ••••••• : 0 ••••••• ·: •••••••
•
0
•
0.4 . . ............ ·: ........ : ........ ~ ....... .
.
.
.
0.2 . . . . . . . . . . . . . . . . . . . . . . . . . . . . .
0~----~------~----~------~------~----~
0 5 10 15 20 25 30
1 .. ---- -:·- ---- -:----- -·.-----·- :-·---- -·-:-----·-
• I I I 0
V) 0.8 . . . ..... : . ....... : ............. .
. . .
] 0.6 . •. :::::::~::::::::~:~::~:::::
>- 0.4 •.
0.2
00
5 10 15 20 25 30
Tl.Dle
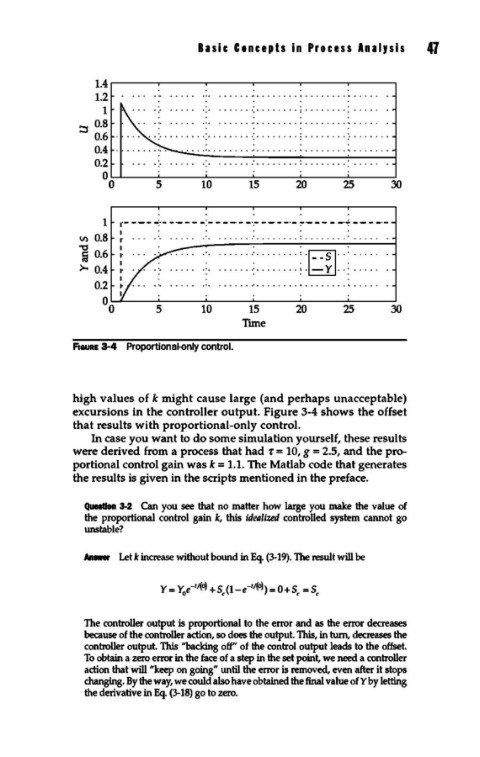
F1auRE 3-4 Proportional-only control.
high values of k might cause large (and perhaps unacceptable)
excursions in the controller output. Figure 3-4 shows the offset
that results with proportional-only control.
In case you want to do some simulation yourself, these results
were derived from a process that had f = 10, g = 2.5, and the pro-
portional control gain was k = 1.1. The Matlab code that generates
the results is given in the scripts mentioned in the preface.
Question 3·2 Can you see that no matter how large you make the value of
the proportional control gain k, this idealized controlled system cannot go
unstable?
Answer Let k increase without bound in Eq. (3-19). The result will be
The controller output is proportional to the error and as the error decreases
because of the controller action, so does the output. This, in turn, decreases the
controller output. This ''backing off" of the control output leads to the offset.
To obtain a zero error in the face of a step in the set point, we need a controller
action that will "keep on going" until the error is removed, even after it stops
changing. By the way, we could also have obtained the final value of Y by letting
the derivative in Eq. (3-18) go to zero.