
Page 141 - Practical Design Ships and Floating Structures
P. 141
116
exactly. Therefore, it is concluded again that the Froude number scaling rules the phenomena and
viscosity and surface tension can be neglected at the critical flow rate of air.
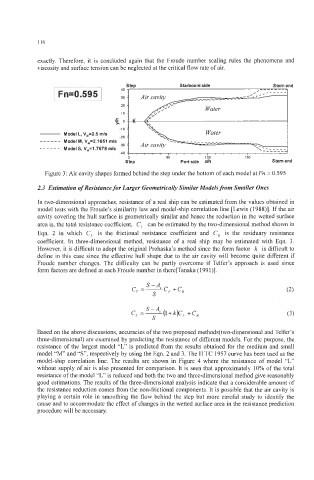
[F n = 0.59 51 Starboard side Stem end
-~
Model L, V,=2.5 mls
------ Model M, V,=2.1651 mls
-30 Air cavity
______ Model S, V,=1.7678 mls
0 50 100 150
step Portside xlh Stem end
Figure 3: Air cavity shapes formed behind the step under the bottom of each model at Fn = 0.595
2.3 Estimation of Resistance for Larger Geometrically Similar Models from Smaller Ones
In two-dimensional approaches, resistance of a real ship can be estimated from the values obtained in
model tests with the Froude’s similarity law and model-ship correlation line [Lewis (1988)l. If the air
cavity covering the hull surface is geometrically similar and hence the reduction in the wetted surface
area is, the total resistance coefficient, C, can be estimated by the two-dimensional method shown in
Eqn. 2 in which CF is the frictional resistance coefficient and CR is the residuary resistance
coefficient. In three-dimensional method, resistance of a real ship may be estimated with Eqn. 3.
However, it is difficult to adopt the original Prohaska’s method since the form factor k is difficult to
define in this case since the effective hull shape due to the air cavity will become quite different if
Froude number changes. The difficulty can be partly overcome if Telfer’s approach is used since
form factors are defined at each Froude number in there[Tanaka (1991)l.
S-A,
CR
c, =- CF -I
S
Based on the above discussions, accuracies of the two proposed methods(tw0-dimensional and Telfer’s
three-dimensional) are examined by predicting the resistance of different models. For the purpose, the
resistance of the largest model “L” is predicted from the results obtained for the medium and small
model “M’ and “S”, respectively by using the Eqn. 2 and 3. The ITTC 1957 curve has been used as the
model-ship correlation line. The results are shown in Figure 4 where the resistance of model “L”
without supply of air is also presented for comparison. It is seen that approximately 10% of the total
resistance of the model “L” is reduced and both the two and three-dimensional method give reasonably
good estimations. The results of the three-dimensional analysis indicate that a considerable amount of
the resistance reduction comes from the non-frictional components. It is possible that the air cavity is
playing a certain role in smoothing the flow behind the step but more careful study to identify the
cause and to accommodate the effect of changes in the wetted surface area in the resistance prediction
procedure will be necessary.