
Page 143 - Practical Design Ships and Floating Structures
P. 143
118
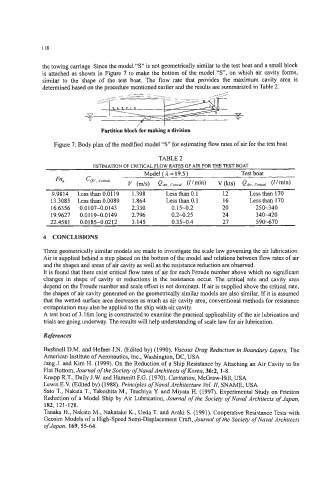
the towing carriage. Since the model “S” is not geometrically similar to the test boat and a small block
is attached as shown in Figure 7 to make the bottom of the model “S, on which air cavity forms,
similar to the shape of the test boat. The flow rate that provides the maximum cavity area is
determined based on the procedure mentioned earlier and the results are summarized in Table 2.
-- -
I
Partition block for making a division
Figure 7: Body plan of the modified model “s” for estimating flow rates of air for the test boat
TABLE 2
ESTIMATION OF CRITICAL FLOW RATES OF AIR FOR THE TEST BOAT
Model (2 = 19.5) Test boat
Fn, e,, crtrtco1
v (&s) Qm. cnrm/ (I /min) V (kt~) QAv. cnrtcal (I /min)
9.9814 Less than 0.0119 1.398 Less than 0.1 12 Less than 170
13.3085 Less than 0.0089 1.864 Less than 0.1 16 Less than 170
16.6356 0.0107-0.0143 2.330 0.15-0.2 20 250-340
19.9627 0.0119-0.0149 2.796 0.2-0.25 24 340-420
22.458 1 0.01 85-0.0212 3.145 0.35-0.4 27 590-670
4 CONCLUSIONS
Three geometrically similar models are made to investigate the scale law governing the air lubrication.
Air is supplied behind a step placed on the bottom of the model and relations between flow rates of air
and the shapes and areas of air cavity as well as the resistance reduction are observed.
It is found that there exist critical flow rates of air for each Froude number above which no significant
changes in shape of cavity or reductions in the resistance occur. The critical rate and cavity area
depend on the Froude number and scale effect is not dominant. If air is supplied above the critical rate,
the shapes of air cavity generated on the geometrically similar models are also similar. If it is assumed
that the wetted surface area decreases as much as air cavity area, conventional methods for resistance
extrapolation may also be applied to the ship with air cavity.
A test boat of 3.16m long is constructed to examine the practical applicability of the air lubrication and
trials are going underway. The results will help understanding of scale law for air lubrication.
References
Bushnell D.M. and Heher J.N. (Edited by) (1990). viscous Drag Reduction in Boundary Layers, The
American Institute of Aeronautics, Inc., Washington, DC, USA
Jang J. and Kim H. (1999). On the Reduction of a Ship Resistance by Attaching an Air Cavity to Its
Flat Bottom, Journal of the Sociery of Naval Architects of Korea, 36:2,1-8.
Knapp R.T., Daily J.W. and Hammitt F.G. (1970). Cavitation, McGraw-Hill, USA
Lewis E.V. (Edited by) (1988). Principles of Naval Architecture Vol. ZZ, SNAME, USA
Sat0 T., Nakata T., Takeshita M., Tsuchiya Y. and Miyata H. (1997). Experimental Study on Friction
Reduction of a Model Ship by Air Lubrication, Journal of the Society of Naval Architects of Japan,
182, 121-128.
Tanaka H., Nakato M., Nakatake K., Ueda T. and Araki S. (1991). Cooperative Resistance Tests with
Geosim Models of a High-speed Semi-Displacement Craft, Journal ofthe Society of Naval Architects
of Japan, 169,55-64.