
Page 164 - Practical Design Ships and Floating Structures
P. 164
I39
4 MODEL-SHIP CORRELATION
The main purpose of the investigation carried out testing two trimaran geosim models has been to have
useful information on the model-ship correlation for this vessels at high speed.
In order to verify the validity of the ITTC’57 correlation methodology, the analysis of the geosim
models results was performed using the residuary resistance coefficients CR calculated by the
expressions:
where the suffix code T, M, 0 are referred to trimaran configuration, main hull and outrigger
respectively.
Because the side hulls are only 50% of the length of the main hull, the frictional resistance coefficient
CF(~
of the trimaran has been determined by considering the CF(M) for the main hull and the CF(O) of
the outriggers at the same speed multiplied by the ratio of their wetted surface areas.
The CF values have been obtained from the ITTC 1957 correlation line.
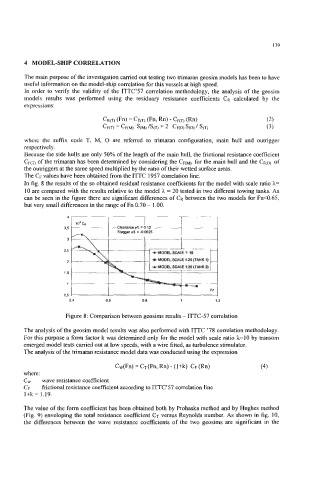
In fig. 8 the results of the so obtained residual resistance coefficients for the model with scale ratio h=
10 are compared with the results relative to the model h = 20 tested in two different towing tanks. As
can be seen in the figure there are significant differences of CR between the two models for Fn<0.65,
but very small differences in the range of Fn 0.70 - 1 .OO.
41 I I I I
10’ cR I I
cR
10’
clearanoeyn=o.12
3.5 - clearanoeyn=o.12
3.5 -
stagger XlL = -0.0625
stagger XlL = -0.0625
I I
2.5
DEL SCALE 1: 10
DEL SCALE 120 (TANK 1)
2
1.5
1
0.5
0.4 0.6 0.8 1 1.2
Figure 8: Comparison between geosims results - ITTC-57 correlation
The analysis of the geosim model results was also performed with ITTC ’78 correlation methodology.
For this purpose a form factor k was determined only for the model with scale ratio h=lO by transom
emerged model tests carried out at low speeds, with a wire fitted, as turbulence stimulator.
The analysis of the trimaran resistance model data was conducted using the expression
-
Cw(Fn) = CT (Fn, b) (l+k) CF (h) (4)
where:
Cw wave resistance coeficient
CF frictional resistance coefficient according to ITTC’57 correlation line
l+k= 1.19.
The value of the form coefficient has been obtained both by Prohaska method and by Hughes method
(Fig. 9) enveloping the total resistance coefficient CT versus Reynolds number. As shown in fig. 10,
the differences between the wave resistance coefficients of the two geosims are significant in the