
Page 259 - Practical Design Ships and Floating Structures
P. 259
234
1
4OW
SOW
j;
moo
-r
rooo -0.25 ~
-050 4 ~-r
ow T' T71 T--, -7 7-T 7
~
040 045 050
-60000 40000 -20000 20000 40000 600 00
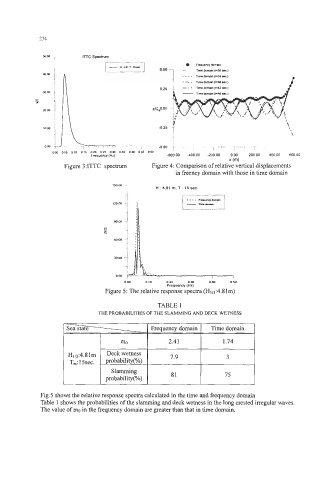
Figure 3:ITTC spectrum Figure 4: Comparison of relative vertical displacements
in freency domain with those in time domain
H : 4.81 m. T : 15 sec
OW 0 10 0 20 030 040 050
Frequency (nz)
Figure 5: The relative response spectra (Hl,3:4.81m)
TABLE 1
==I
THE PROBABILITIES OF THE SLAMMING AND DECK WETNESS
Sea state Frequency domain Time domain
I
I mo
81 I 75 I
I I
Fig.5 shows the relative response spectra calculated in the time and frequency domain
Table 1 shows the probabilities of the slamming and deck wetness in the long crested irregular waves.
The value of mo in the frequency domain are greater than that in time domain.