
Page 265 - Practical Design Ships and Floating Structures
P. 265
240
non-convergent solution in using the first order reliability method (FORM). Thus, the simulation-based
stochastic finite element approach becomes very attractive in performing vulnerability assessment of
ship structures under extreme dynamic loading.
EXAMPLE APPLICATION OF SIMLAB
An elastoplastic hull girder subjected to a stationary Gaussian process is considered here to investigate
the effect of material nonlinearity on the statistical distributions of peak and extreme values. The hull
girder is discretized into 24 beam elements. At each nodal point, a nodal mass is assigned to represent
the sum of the structural mass (Ms), and the added mass (MA). The structural mass consists of both the
material mass (MM) and the equipment mass (ME). The safety margin for the n-th beam element is
defined as
G, (t, X, 1 = 0; - (1, X, ) (1)
where 0; is the yield strength of the n-th beam element and oc;f (t, x,) is the VonMises stress of the n-
th element at time t. The limit state function is given by
G = rnin{GG,(t,x,)); l<n<M; t E [O, T] (2)
where M is the total number of beam elements and T is the termination time of response
analysis.
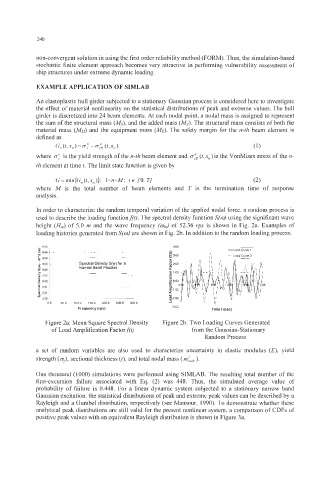
In order to characterize the random temporal variation of the applied nodal force, a random process is
used to describe the loading function f(Q. The spectral density function S(u) using the significant wave
height (H,) of 5.0 rn and the wave frequency (u,J of 52.36 rps is shown in Fig. 2a. Examples of
loading histories generated from S(u) are shown in Fig. 2b. In addition to the random loading process,
.--
,, -Loadcurve 1 I I
1
I -~
-
Spectral Density S(w) for a I I
1:
1 Narrow Band Process 1
0
\
-A
500 1000 1500 2000 2500 3000
Frequency (rpo) Timet (sec)
Figure 2a: Mean Square Spectral Density Figure 2b: Two Loading Curves Generated
of Load Amplification Factor f(Q from the Gaussian-Stationary
Random Process
a set of random variables are also used to characterize uncertainty in elastic modulus (E), yield
strength (a,), sectional thickness (t), and total nodal mass ( mIo,).
One thousand (1 000) simulations were performed using SIMLAB. The resulting total number of the
first-excursion failure associated with Eq. (2) was 448. Thus, the simulated average value of
probability of failure is 0.448. For a linear dynamic system subjected to a stationary narrow band
Gaussian excitation, the statistical distributions of peak and extreme peak values can be described by a
Rayleigh and a Gumbel distribution, respectively (see Mansour, 1990). To demonstrate whether these
analytical peak distributions are still valid for the present nonlinear system, a comparison of CDFs of
positive peak values with an equivalent Rayleigh distribution is shown in Figure 3a.