
Page 266 - Practical Design Ships and Floating Structures
P. 266
24 1
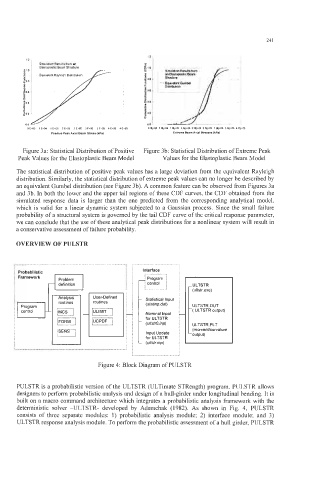
Figure 3a: Statistical Distribution of Positive Figure 3b: Statistical Distribution of Extreme Peak
Peak Values for the Elastoplastic Beam Model Values for the Elastoplastic Beam Model
The statistical distribution of positive peak values has a large deviation from the equivalent Rayleigh
distribution. Similarly, the statistical distribution of extreme peak values can no longer be described by
an equivalent Gumbel distribution (see Figure 3b). A common feature can be observed from Figures 3a
and 3b. In both the lower and the upper tail regions of these CDF curves, the CDF obtained from the
simulated response data is larger than the one predicted from the corresponding analytical model,
which is valid for a linear dynamic system subjected to a Gaussian process. Since the small failure
probability of a structural system is governed by the tail CDF curve of the critical response parameter,
we can conclude that the use of these analytical peak distributions for a nonlinear system will result in
a conservative assessment of failure probability.
OVERVIEW OF PULSTR
~ .............................................................................................. ......................................................
~ ...........................
Probabilistic Interface ~ . : .
Framework r control ; ; i
I program
definition ........................... i 1 ULTSTR
control I iMCS I ..................... forULTSTR i
(ultstr.exe)
Statistical Input
routines
~
(sfafinpdat)
ULTSTR.OUT
................
...................
...............
_ ....................
% _ ................, lULlMlT f : Nominal Input - ( ULTSTR output)
L
;
1 : ;FORM f iUCPDF ; ULTSTR.PLT
: ........... .....-
,
i .................... I (ultsfrU.inp)
:SEAS""'i
(momentlcurvature
;
Input Update
................... Ill
forULTSTR 1 output)
1 (ulfstr.inp)
...........................................................
Figure 4: Block Diagram of PULSTR
PULSTR is a probabilistic version of the ULTSTR (ULTimate STRength) program. PULSTR allows
designers to perform probabilistic analysis and design of a hull-girder under longitudinal bending. It is
built on a macro command architecture which integrates a probabilistic analysis framework with the
deterministic solver -ULTSTR- developed by Adamchak (1982). As shown in Fig. 4, PULSTR
consists of three separate modules: 1) probabilistic analysis module; 2) interface module; and 3)
ULTSTR response analysis module. To perform the probabilistic assessment of a hull girder, PULSTR