
Page 321 - Practical Design Ships and Floating Structures
P. 321
296
NPV
I
Frameworks
Fig. 2 Variation in NPV with increasing preparation for upgrade
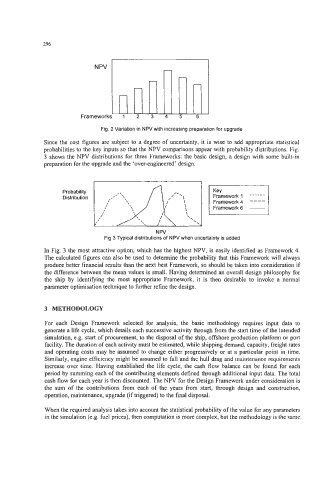
Since the cost figures are subject to a degree of uncertainty, it is wise to add appropriate statistical
probabilities to the key inputs so that the NPV comparisons appear with probability distributions. Fig.
3 shows the NPV distributions for three Frameworks: the basic design, a design with some built-in
preparation for the upgrade and the ‘over-engineered’ design.
Key
Framework 1 ------
Framework 4 ----
Framework6 -
NPV
Fig 3 Typical distributions of NPV when uncertainty is added
In Fig. 3 the most attractive option, which has the highest NPV, is easily identified as Framework 4.
The calculated figures can also be used to determine the probability that this Framework will always
produce better financial results than the next best Framework, so should be taken into consideration if
the difference between the mean values is small. Having determined an overall design philosophy for
the ship by identifying the most appropriate Framework, it is then desirable to invoke a normal
parameter optimisation technique to further refine the design.
3 METHODOLOGY
For each Design Framework selected for analysis, the basic methodology requires input data to
generate a life cycle, which details each successive activity through from the start time of the intended
simulation, e.g. start of procurement, to the disposal of the ship, offshore production platform or port
facility. The duration of each activity must be estimated, while shipping demand, capacity, freight rates
and operating costs may be assumed to change either progressively or at a particular point in time.
Similarly, engine efficiency might be assumed to fall and the hull drag and maintenance requirements
increase over time. Having established the life cycle, the cash flow balance can be found for each
period by summing each of the contributing elements defined through additional input data. The total
cash flow for each year is then discounted. The NPV for the Design Framework under consideration is
the sum of the contributions from each of the years from start, through design and construction,
operation, maintenance, upgrade (if triggered) to the final disposal.
When the required analysis takes into account the statistical probability of the value for any parameters
in the simulation (e.g. fuel prices), then computation is more complex, but the methodology is the same