
Page 323 - Practical Design Ships and Floating Structures
P. 323
298
may be regarded as Framework 1, the minimum ship. He may decide that the growth rate is such as to
build an overlarge ship (and thus expensive) ship at the start, say one-third bigger, even though such a
ship may be underutilised for about twelve years out of an assumed twenty year life (Framework 6). Or
he might decide to pay a modest premium, by designing for jumboisation in thc futurc, by installing a
more powerful engine and increased scantlings and larger margins on equipment. (Framework 4)
The software enables all such variations to be explored, over differing life cycles. Estimates can be
made of the different performance and construction costs of these three (or more) alternatives. The
largest uncertainties lie in the prediction of future market trends, both in terms of cargo growth rate and
in variation of freight rates. Other influences include fuel prices, and when to assume the upgrade will
take place.
A typical ship in the fleet is taken, together with a typical service schedule. The basic ‘cycle time‘ is a
round voyage of 28 days with four ships providing a weekly frequency, all operating at 23 knots in
service. Sea time is regarded as ‘production’ time, port time as ‘idle time’, while drydocking is part of
maintenance time. Four types of ‘production’ are included: 20ft containers outward, 20ft homeward,
4Oft outward, 40ft homeward. Different freight rates and growth trends are applied to each.
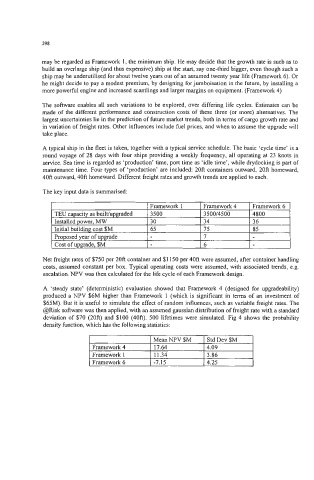
The key input data is summarised:
Net freight rates of $750 per 20ft container and $1 150 per 40ft were assumed, after container handling
costs, assumed constant per box. Typical operating costs were assumed, with associated trends, e.g.
escalation. NPV was then calculated for the life cycle of each Framework design.
A ‘steady state’ (deterministic) evaluation showed that Framework 4 (designed for upgradeability)
produced a NPV $6M higher than Framework 1 (which is significant in terms of an investment of
$65M). But it is useful to simulate the effect of random influences, such as variable freight rates. The
@Risk software was then applied, with an assumed gaussian distribution of freight rate with a standard
deviation of $70 (20ft) and $100 (40ft). 500 lifetimes were simulated. Fig 4 shows the probability
density function, which has the following statistics:
I Mean NPV $M I Std Dev $M
Framework 4 I 17.64 14.09
Framework 1 I 11.34 13.86
Framework 6 1-7.15 14.25