
Page 324 - Practical Design Ships and Floating Structures
P. 324
299
80
Freight Rate (Gaussian Distribution)
70
I
i Framework6 rl
60 4 Framework4
‘\ Framework1 / \ d
50
h
C
2 40
0- 8
E
LL 41
30
I
I 8
20 I
8
10
0
-21 -18 -15 -13 -11 -9 -6 -4 -1 1 3 5 8 10 13 15 18 20 23 25 28
NPV
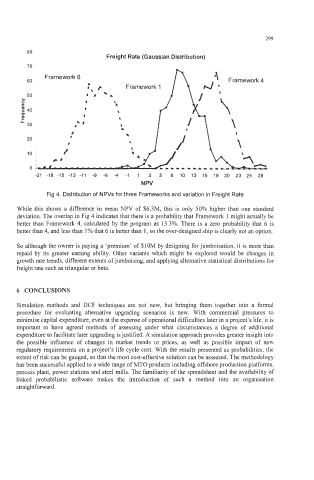
Fig 4. Distribution of NPVs for three Frameworks and variation in Freight Rate
While this shows a difference in mean NPV of $6.3M, this is only 50% higher than one standard
deviation. The overlap in Fig 4 indicates that there is a probability that Framework 1 might actually be
better than Framework 4, calculated by the program as 13.3%. There is a zero probability that 6 is
better than 4, and less than 1% that 6 is better than 1, so the over-designed ship is clearly not an option.
So although the owner is paying a ‘premium’ of $10M by designing for jumboisation, it is more than
repaid by its greater earning ability. Other variants which might be explored would be changes in
growth rate trends, different extents of jumboising, and applying alternative statistical distributions for
freight rate such as triangular or beta.
6 CONCLUSIONS
Simulation methods and DCF techniques are not new, but bringing them together into a formal
procedure for evaluating alternative upgrading scenarios is new. With commercial pressures to
minimise capital expenditure, even at the expense of operational difficulties later in a project’s life, it is
important to have agreed methods of assessing under what circumstances a degree of additional
expenditure to facilitate later upgrading is justified. A simulation approach provides greater insight into
the possible influence of changes in market trends or prices, as well as possible impact of new
regulatory requirements on a project’s life cycle cost. With the results presented as probabilities, the
extent of risk can be gauged, so that the most cost-effective solution can be assessed. The methodology
has been successful applied to a wide range of MTO products including offshore production platforms,
process plant, power stations and steel mills. The familiarity of the spreadsheet and the availability of
linked probabilistic software makes the introduction of such a method into an organisation
straightforward.