
Page 379 - Practical Design Ships and Floating Structures
P. 379
354
Figure 4: Comparison of average percentage error for power
function regression, neural network and Bayesian network.
0
%s
a
$3
E=
0
5
0
mu
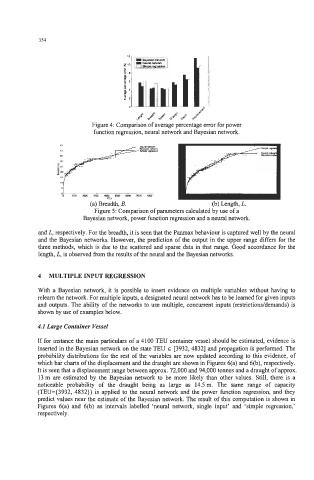
(a) Breadth, B. (b) Length, L.
Figure 5: Comparison of parameters calculated by use of a
Bayesian network power function regression and a neural network.
and L, respectively. For the breadth, it is seen that the Panmax behaviour is captured well by the neural
and the Bayesian networks. However, the prediction of the output in the upper range differs for the
three methods, which is due to the scattered and sparse data in that range. Good accordance for the
length, L, is observed from the results of the neural and the Bayesian networks.
4 MULTIPLE INPUT REGRESSION
With a Bayesian network, it is possible to insert evidence on multiple variables without having to
relearn the network. For multiple inputs, a designated neural network has to be learned for given inputs
and outputs. The ability of the networks to use multiple, concurrent inputs (restrictions/demands) is
shown by use of examples below.
4.1 Large Container Vessel
If for instance the main particulars of a 4100 TEU container vessel should be estimated, evidence is
inserted in the Bayesian network on the state TEU E [3932,4832] and propagation is performed. The
probability distributions for the rest of the variables are now updated according to this evidence, of
which bar charts of the displacement and the draught are shown in Figures 6(a) and 6(b), respectively.
It is seen that a displacement range between approx. 72,000 and 94,000 tonnes and a draught of approx.
13 m are estimated by the Bayesian network to be more likely than other values. Still, there is a
noticeable probability of the draught being as large as 14.5m. The same range of capacity
(TEU={3932, 4832)) is applied to the neural network and the power function regression, and they
predict values near the estimate of the Bayesian network. The result of this computation is shown in
Figures 6(a) and 6(b) as intervals labelled 'neural network, single input' and 'simple regression,'
respectively.