
Page 376 - Practical Design Ships and Floating Structures
P. 376
351
Input Hidden layer output layer atput
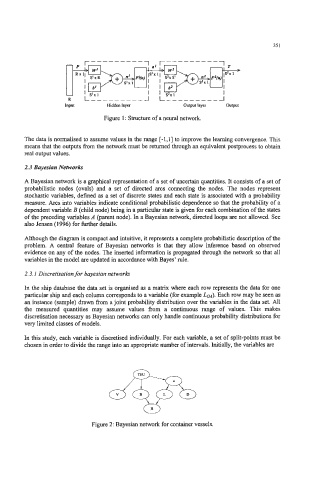
Figure 1 : Structure of a neural network.
The data is normalised to assume values in the range [-1,1] to improve the learning convergence. This
means that the outputs from the network must be returned through an equivalent postprocess to obtain
real output values.
2.3 Bayesian Networks
A Bayesian network is a graphical representation of a set of uncertain quantities. It consists of a set of
probabilistic nodes (ovals) and a set of directed arcs connecting the nodes. The nodes represent
stochastic variables, defined as a set of discrete states and each state is associated with a probability
measure. Arcs into variables indicate conditional probabilistic dependence so that the probability of a
dependent variable B (child node) being in a particular state is given for each combination of the states
of the preceding variables A (parent node). In a Bayesian network, directed loops are not allowed. See
also Jensen (1 996) for further details.
Although the diagram is compact and intuitive, it represents a complete probabilistic description of the
problem. A central feature of Bayesian networks is that they allow inference based on observed
evidence on any of the nodes. The inserted information is propagated through the network so that all
variables in the model are updated in accordance with Bayes’ rule.
2.3. I Discretisation for bayesian networh
In the ship database the data set is organised as a matrix where each row represents the data for one
particular ship and each column corresponds to a variable (for example LOA). Each row may be seen as
an instance (sample) drawn from a joint probability distribution over the variables in the data set. All
the measured quantities may assume values from a continuous range of values. This makes
discretisation necessary as Bayesian networks can only handle continuous probability distributions for
very limited classes of models.
In this study, each variable is discretised individually. For each variable, a set of split-points must be
chosen in order to divide the range into an appropriate number of intervals. Initially, the variables are
Figure 2: Bayesian network for container vessels.