
Page 88 - Practical Design Ships and Floating Structures
P. 88
63
3.3 Analysis
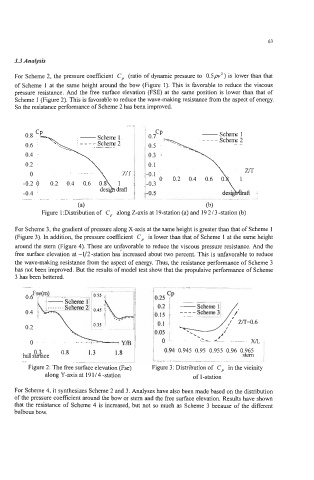
For Scheme 2, the pressure coefficient C, (ratio of dynamic pressure to 0.5~') is lower than that
of Scheme 1 at the same height around the bow (Figure 1). This is favorable to reduce the viscous
pressure resistance. And the free surface elevation (FSE) at the same position is lower than that of
Scheme 1 (Figure 2). This is favorable to reduce the wave-making resistance from the aspect of energy.
So the resistance performance of Scheme 2 has been improved.
0.1
-
0.1 - I 1 --1
b
0.3 - 0.2 0.4 0.6
.. ..
Figure 1:Distribution of C, along Z-axis at 19-station (a) and 192/3 -station (b)
For Scheme 3, the gradient of pressure along X-axis at the same height is greater than that of Scheme 1
(Figure 3). In addition, the pressure coefficient C, is lower than that of Scheme 1 at the same height
around the stem (Figure 4). These are unfavorable to reduce the viscous pressure resistance. And the
free surface elevation at -1/2-station has increased about two percent. This is unfavorable to reduce
the wave-making resistance from the aspect of energy. Thus, the resistance performance of Scheme 3
has not been improved. But the results of model test show that the propulsive performance of Scheme
3 has been bettered.
10.25
0.2
0.15
0.1
0.05
0
i 0.94 0.945 0.95 0.955 0.96 0.965
ihdlskkce o'8 1.3 1.8 1 stem
Figure 2: The free surface elevation (Fse) Figure 3: Distribution of C, in the vicinity
along Y-axis at 19 1 / 4 -station of 1 -station
For Scheme 4, it synthesizes Scheme 2 and 3. Analyses have also been made based on the distribution
of the pressure coefficient around the bow or stem and the free surface elevation. Results have shown
that the resistance of Scheme 4 is increased, but not so much as Scheme 3 because of the different
bulbous bow.