Page 165 - Pressure Swing Adsorption
P. 165

HI
         !i  I
              140                                   PRESSURE SWING ADSORPTION                  EQUILIBRIUM THEORY                                           141

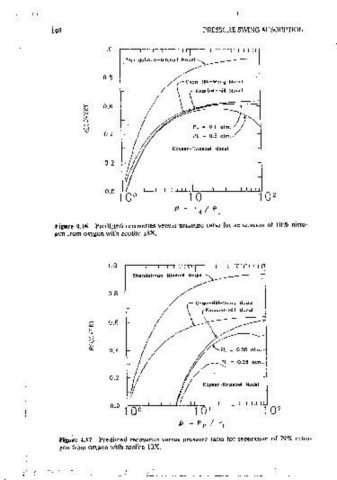
                                                                                               sorpt1on  of  oxygen),  are  m  good  agreement  at  low  to  moderate  pressure
                           i .0
                                                                                               ratios.  Even when  curvature  of the  nitrogen  isotherm- ts  taken  into  account,
                                 Shandalman-Mlkhell  Model
                                                                                               the differences  are  mmor,  as  long  as  PL  1s  small.  When  H ts  raised  to Just
                                                                                               0.25  atm,  to  correspond  to  the  comoanson  m  Table  4.2,  the  effect  of
                           0.8
                                               Chon-HUI-Wong  Model
                                                                                               curvature  becomes oronouncet1  at  high  pressure ratios.
                                                (' Knaebel-HIii  ·Model                          For the more typical  feed  composition  of 79%  mtr:ogen  and ·21 %  oxygen.
                                                                                               shown  in  Figure 4.17,  there is  practically  no  agreement among  the  modeis.
                      >-   0.6
                      ~                                                                        That figure clearly shows the magnitude of ctev1ations,cau"Sed  by 1gnormg: (I)
                      w
                      >                                                                        sorption  of the  light  component  (the  difference  between  the  Shenctalman-
                      0
                      u
                      w                          PL=  0.1  aim.//                              Mitchell  model  and  that  of  Chan  et  al.),  (2)  compos1t1on  deoendence  of
                      ~
                           0.4                   PL  =  0.5  aim,/                             interstitial velocity (the difference between the model of Chan et al.  and  the
                                                                                               Knaebel-Hill  model),  (3)  the  effect  of  ,sothenn  curvature  (the  difference
                                            Kayser-Knoebel  Model
                                                                                               between  the  model  of Knaebel-Hill  and  the  Kayser~Knaebel  model),  and
                           0.2                                                        ! '      finally (4) the 1moact of absolute oressure when the 1sotherrns are not linear
                                                                                               (the difference between the values of PL  within the Kayser-Knaebel model).
                                                                                               In  all  of  these  comoansons,  recovery  (at  a  given  pressure  ratio)  is  always
                                                                  1 0  2                       dimmished by taking mto account more of the effects mentioned.
                                                                                                  4.6.2  Four-Step PSA Cycle:  Pressurization with  Feed
               Figure 4.16  Predicted  recoveries versus pressure  ratio for  separation of 10%  nitro-  The differences  between  the  assumptions of the  mode is  of Chan et al.}  and
               gen from  oxygen with zeolite  13X.                                                            13
                                                                                                Knaebel and Hill  are also evident in  PSA cycles that empioy pressurization


                                                                                                             i.O
                            o.O
                                  Shendalmon-Mitchell  Model                                                       Chan-Hill-Wong  I.lode!  --
                                                                                                                   Kna~bel-H!ll  Model   --
                            0.8                                                                              0.8
                                                r Chon-Hill-Wong  Model               I                                            =  0.1
                                                \   f Knoebel-HIil  Model
                                                                                                        >-   0.6
                       >-   0.6
                       ~                                                                                °'
                                                                                                        w
                       w
                       >                                                                                >
                                                                                                        0
                       0                                                                                u
                       u                                                                                w
                       w
                       ~                                PL  =  0.05  aim.                               "'   0.4
                            0.4
                                                                                                                                 fJ  =  0.5
                                                           =
                                               rL 0.25  otm.
                                                                                                             0,2
                            0,2
                                              I/  I  Koym-Knoobot  "•dot                                                         fJ  =  0.9
                             0,0  1 oo                                                                                                              1 0  2
                Figure 4.17  Predicted  recoveries versus pressure ratio  for  separation of 79%  nitro-  Figure 4.18  Recovery versus fl for various adsorbent seiectivities,  y 8  = 0.9, compar~
                gen from  oxygen with zeolite 13X.                                              ing the models of Chan et al.  and  Knaebel  and  Hill.   F   ·
   160   161   162   163   164   165   166   167   168   169   170