
Page 168 - Pressure Swing Adsorption
P. 168
142 PRESSURE SWING ADSORPTION EQUILIBRIUM THEORY
143
i.O 4. 7 Design Example
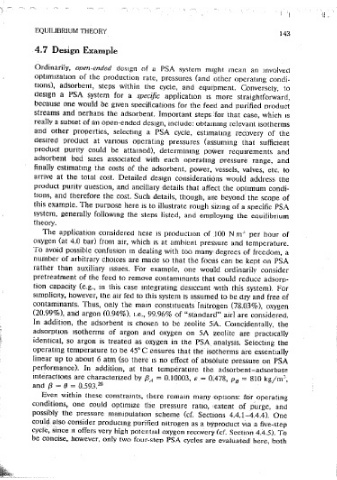
Chan-HUI-Wong Model --
Kno11b•I-HIII Model --
Ordinarily, open-ended (lcs1gn of a PSA system might mean an involved
0.8 opt1m1zat10n of the production rate, pressures (and other operating condi-
tions), adsorbent, steps within the cycle, and equipment. Conversely, to
design a PSA system for a specific application is more straightforward,
>- 0.6 = O.i because one would be given soecifications for the feed and ourified product
°' streams and oerhaos the adsorbent. Important steps :for that case, which 1s
uJ
>
0 really a subset of an open-ended design, include: obtammg relevant isotherms
0
uJ and other properties, seiectmg a PSA cycle, est1rnatmg recovery of the
°' 0.4
= 0.5 desired product at vanous operating pressures (assuming that sufficient
oroduct ourity could be attained), determinmg poWer reqrnrements and
adsorbent bed sizes associated with each ooeratmg oressure range, and
0.2
finally estimatmg 'the costs of the adsorbent. power, vessels, valves, etc. to
P = 0.9 arnve at the total cost. Detailed design considerations would address the
0.0 1 oo product purity question, and ancillary details that affect the oot1mum condi-
tions, and therefore the cost. Such details, though, ar,e beyond the scope of
i this example. The ouroose here is to illustrate rough Sizing of a specific PSA
system, generally followmg the steps listed, and emriloymg the eauilibnum
Figure 4.19 Recovery versus fJ for various adsorbent selecttvities, yl.l , = 0.1 accord- I theory.
1
mg to the motlcl of Knaebel and Hill. The application considered here 1s production of .100 Nm·' per hour of
oxygen (at 4.0 bar) from air, which 1s at amhieni pressure and temperature.
To avoid possible confusion m dealing with too many degrees of freedom, a
number of arbitrary chmces are made so that the focus can be kept on PSA
with feed. This section bnefly discusses the aualitattve and auant1tattve rather than auxiliary issues. For examoie, one wou'ld ordinarilv consider
differences between Eas. 4.29 and 4.30. pretreatment of the feed to remove contaminants that could reduce adsorp-
The approach follows that of the previous sect10n in which conditions are tion capacity (e.g., m this case mtegrating desiccant with this system). For
chosen first to be reasonably valid for both models; the conditions are then s1rnplic1ty, however, the air fed to this system is assumed to be dry and free of
aitered to vioiate the simpler model. In both cases the model predictions are contaminants. Thus, only the main constituents f nitrogen (78.03% ), oxygen
compared to show the Jl1agmtudes of the potential errors due to overslmoli- (20.99%), and argon (0.94%), 1.e., 99.96% of "standard" a,rl are considered.
fication. Generally, Figures 4.18 and 4.19 comoare the modeis of Chan et al. In addition, the adsorbent 1s chosen to be zeolite 5A. Comcidentally, the
and Knaebel and Hill· by showing. the deoendenc_e of recovery on §J for adsorot1on isotherms of argon and oxygen on 5A rzeolite are practlcally
vanous adsorbent selectiv1t1es. Specifically, Figure 4.18 shows relatively close identical, so argon is treatf:ct as oxygen in the PSA. analysis. Sel~cting the
predict10ns for ,YA, - 0.1 (y , - 0.9). Conversely, Figure 4.19 shows larger operatmg temperature to be 45° Censures that the· isotherms are essentrnlly
8
discrepancies between the predicted recoveries, especially at lower pressure linear up to about 6 atm (so there 1s no effect of absolute pressure on PSA
ratios, for yAF = 0.5 { = y F). It should be emphasizect that the lower values performance). In addition, at that temperature the adsorbent-adsorbate
8
are considered to be more accurate, because the assumptions are less mteract1ons are charactenzed by {3A - 0.10003, e - 0.478, p 8 - 810 kg/m',
restrictive. In both figures, the differences dimimsh as the pressure ratio and (3 = 8 - 0.593. 20
mcreases, implying that the tmpact of compos1t1on dependence on gas Even within these constramts, there remam mariy 'Options: for _opcratmg
velocity becomes relatively smaller. Both of thOse figures also show that conditions, one could opt1m1ze the oressure ratio, ,extent of oUrge, and
maximum recovery occurs at an mtermediate pressure ratio for systems with possibly the pressure maniouJat,on Scheme (cf. Sections 4.4.1-4.4.4). One
moderate .to iow selecttvities•(i.e., fJ > 0.4). Such behav10r is not observed for cou_ld ~-!so consider producing purified nitrogen as a byproduct via a five~step
the custi of pressurizntlon with product, except for nonlinear isotherm:-. at cycle, since ii offers very high potcntrnl oxygen recovery (cf. Section 4.4.5). To
relatively high values of PL· be concise, however, only two four~sten PSA cycles are evaluated here, both