
Page 238 - Pressure Swing Adsorption
P. 238
I
214
PRESSURE SWING ADSORPTION DYNAMIC MODELING OF A PSA SYSTEM 215
when the beds are m1tially clean. Starting the svstem from a saturated
condition leads to a different steady state with s1gnifiCantly different orofiles
saturated bed of both concentration and temperature and a less pure finai product. Steady-
. ' ) ·' saturated bed state bed profiles for clean and saturated bed mitial conditions are shown m
.. J Figure 5.15. This 1s equally true for both linear and nonlinear eouilibrmm
isotherms. Different cyclic steady states corresponding to clean and saturated
. ' bed mitial conditions may also be obtamed for an isothermal system when
ll the equilibrium relattonshio is nonlinear. , In their: study Farooq, Hassan,
19 25
~
u
and Ruthven further showed that for a linear 1sbthermal system the steady
• 4
state is unique and the solution of the model equations (using a large value of
h or AH= 0) converges to the same final cyclic steady state from all initial
conditions. It 1s clear that mult1plic1ty can anse only when the equat10ns
• 2
contain a significant nonlineanty. In the isothermal case the noniineanty
comes from curvature of the eauilibnum isotherm, but in a nomsothennal
a ., .. .. linear equilibrmm system the same type of behavior arises from the tempera-
0 • 2 • 4 .6 ture dependence of the adsorption equilibnum constant.
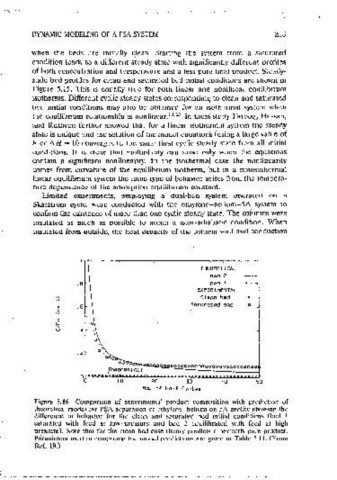
Z/L Z/L j' Limited experiments, employing a dual-bed system operated on a
(al (bl I Skarstrom cycle. were conducted with the ethylene.-helium-5A system to
confirm the existence of more than one cyclic steady state. The columns were
JO
insulated as much as possible to attam a near-aditibat1c condition. When
insulated from outside, the heat caoacttv of the coiumn wall and conduction
THEORETIC"L
0 bQd 2
r • 8 bgd i
EXPERIMENTAL
Cl•mn b,;,id
" .6f Sat.uroted bl.!d 0
;;
~
-s saturated bed / u 0 •
' u ' I '
'1 '
0
'
. 2f 00 00
00
Z/L 00000000000000000000000000
Th1,1or-1at1ca1
{c)
20 30 40 so
Figure 5.15 Computed profiles for PSA air drying on activated aiumma showmg No. of Half Cyclgs
approach to cyclic steady state from clean bed initial conditions. Steady-state profiles
with both beds mitially equilibrated with feed at high pressure are also shown. The Figure 5.16 Comparn;on of expcnmemal product composition with prediction of
profiles represent the !;md of the high-pressure adsorptmn step and, starting for a theoretical model for PSA separauon or ethylene-helium On 5A zcolite showmg the
clean bed, are shown after 19, 39, 49, 59, 69, 79, 89, 99, and 109 half-cycles. difference in behavior for the clean and saturated bed initial conditions (bed 1
(a) Gas-phase concentration profile, (b) adsorbed-phase concentrat10n nfofile, saturated with feed at Jow pressure and bed 2 eauilibrated with feed at high
(c) temperature, profile. Parameters used m the numericai simutat1on are given m pressure). Note that for the clean bed case theory predicts' a perfectly pure product.
Table 5.11. (From Ref. 19.)
Parameters used in computmg the model predictions are given m Table 5.11. ffrom
Ref. 19.)