
Page 74 - Pressure Swing Adsorption
P. 74
48 PRESSURE SWING ADSORPTION
FUNDAMENTALS OF ADSORPTION 49
Table 2.7. Diffusion of Atmosphenc Gases in Vanous zeolites
and Molecular Sieve Carbons"
Sorbent Sorhace T/K) D (cm~ s ''J £ Ckcal/mote)
13X Zeolitc. o, 2{)0 2.) y !()' f, .1,4
.,.
N, 200 2./l A ]() 1.3
SA Zeolite o, 200 2.2 X J{)- 7 2.7
N, 200 L2 X 10- 7 2.5
Ac 200 5.5 X HJ- 7
4A Zeolite o, 273 l.6 X 10--!I 4.5
N, 27l 4XJ0-H! 5,6
< " ,
Ar 273 J X 10--11 .
CMS 02 300 J X 10·-ll 5.5
1.0<-------------------l
(cl (Berghau) N, 3()0 LI X 10 " ,, 6.5
CMS o, 1()0 1.9;, 10 6.o
(Takeda) N, 300 3.4 X 10-HJ 7.4
{Thin Bed. 12.5mg, 273 K}
11 1 1
0,11a ftrl' from Xu d uL~ Ru1hven and Derrnh. ~ Ruthv~'n t'l aL.'·' ,md Chihara t~I :il.~ hllntl·1-v-:-
tallinc diffusivity values i\fC quilted al the spccilicd tcmpcra1u1·c. Fi•r MSC :1 1111111111:il 1i11\"1'1'1'•lrtidc
radius of l µ,m is assumed. In pracm:e, m SA and UX zeolites the controlling rc~1stance 1s macropore
01
diffusion; so these values do noc relate Uircc1ly to sorpt!On rate5.
20 40 60 80 100 120 140
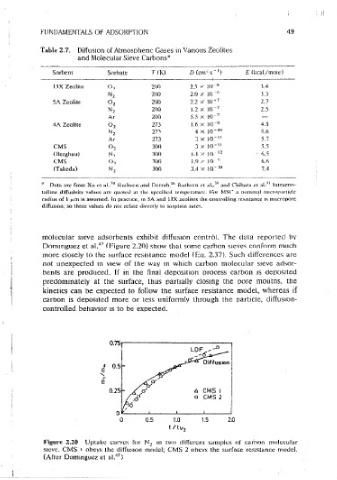
molecular sieve adsorbents exhibit diffusion contrOI. The data reported nv
t (sec) 47
Dommguez et al. ( Figure 2.20) show that some caihon sieve<; conform much
Figure 2.19 So1puon curves for CO~ rn SA zcohtc crvstals showmg conform1tv with more closely to the .surface resistance model (En. 2·,37). Such differences are
the heat transfer comrol modci. (Fro~ Ruthven et al 45 ) not unexpected 1n view of the way m which carbon moiecular sieve adsor-
bents are produced. If in the final deposition process carbon is deposited
predominateiy at the surface, thus partially clos1flg the pore mouths. the
eauilibnum in the \ong~tune region 1s loganthm1c. However, m the case of kinetics can be expected to follow the surface resistance model, whereas if
mass transfer controi the intercept of a olot of log(l - mJm,,) versus f is carbon is deposited more or less uniformly through the part1c1e, diffus1on-
mvanant, whereas for heat transfer control this intercept [,B/(1 + ,B)l vanes controlled behavior 1s to be expected.
with sorbate concentration because of the noniineanty of the equilibnum
relationship.
0.75
2.3.9 Kinetically Selective Adsorbents
The different rate-controlling mechanisms delineated here are clearly illus- I 0.5
E
trated by the sorption kinetics of oxygen and nitrogen m the common PSA ....
adsorbents. The adsorbents used m the PSA production of nitrogen (carbon E O'
molecuiar sieves or 4A zeolite) depend on the difference in sorpt1on rates 0.25 ;pa A CM$ i
between oxygen and mtrogcn. The oxygen molecule 1s slightly smaller anJ 0 CMS 2
therefore diffuses faster m criticallv sized m1cropores ( ~ 4 A). Representative , '6
0
gravimetric uptake curves for oxygen and mtrogen m 4A zeolite and m
0 0.5 1.0 1.5 2J)
carbon molecular sieve showmg conformity with the diffusion motiei are t ltv
1
shown m Fiµurc 2.17, and the. Arrhenius tcmrcrnturc dependence of the
m1cn.morc diffusivities IS shown 111 Figure 2. lR A summary of ditfu.sivit1es and Figure 2.20 Uptake curves for N 2 m two diffcrcm sampics of carh<,n mnlcculi1r
sieve. CMS I oheys the diffusion model; CMS 2 obcvs the surface rcs1~tance model.
llitrus1onal activatllm energies 1s given in Table 2.7. However, not all carhon 7
{Afwr D(1m1ngucz ct al.~ )