
Page 196 - Primer on Enhanced Oil Recovery
P. 196
EOR modeling 185
three-dimensional grid (3D grid). The grid is a cellular framework within which all
the main stages of geological modeling take place.
The main difference between a three-dimensional grid and a two-dimensional
grid is that each cell of a three-dimensional grid occupies a certain volume in space,
whereas a cell of a two-dimensional grid is characterized only by the area. A well-
constructed three-dimensional grid is the basis for building a correct geological
model. The vertical dimensions of the model cells are selected taking into account
the differentiation of the section according to filtration capacitive properties. The
vertical resolution of the grid is determined by the number of layers, which are
selected in such a way that it was possible to most adequately restore the reservoir
distribution space, without losing a single interlayer. The horizontal increments of
the grid are chosen by taking into the account well placements, well density and the
size of the whole oil field (formation).
Grid curves of facies, lithology, porosity, and oil saturation are transferred
(averaged) to mesh cells along the drilled well trajectories.
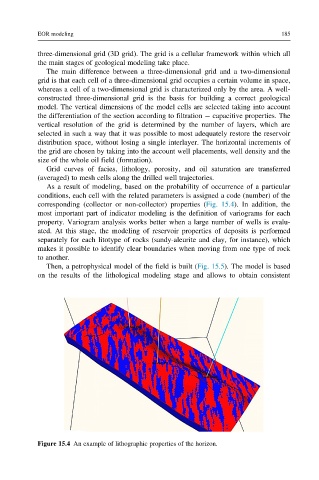
As a result of modeling, based on the probability of occurrence of a particular
conditions, each cell with the related parameters is assigned a code (number) of the
corresponding (collector or non-collector) properties (Fig. 15.4). In addition, the
most important part of indicator modeling is the definition of variograms for each
property. Variogram analysis works better when a large number of wells is evalu-
ated. At this stage, the modeling of reservoir properties of deposits is performed
separately for each litotype of rocks (sandy-aleurite and clay, for instance), which
makes it possible to identify clear boundaries when moving from one type of rock
to another.
Then, a petrophysical model of the field is built (Fig. 15.5). The model is based
on the results of the lithological modeling stage and allows to obtain consistent
Figure 15.4 An example of lithographic properties of the horizon.