
Page 117 - Principles of Applied Reservoir Simulation 2E
P. 117
102 Principles of Applied Reservoir Simulation
The N.E. Nash Unit has a gradual dip from north to south. The Misener
sandstone reservoir is bounded above by the Woodford shale, on the flanks by
the Sylvan shale, and below by the Viola limestone. The Viola limestone does
allow some aquifer support for the Misener sandstone.
One of the primary tasks of the study was to map the N.E. Nash Unit. Two
sets of maps were prepared: conventional hand-drawn maps, and a set of maps
based on a geostatistical analysis of the field. The hand-drawn maps correspond
to the deterministic approach in which a single realization is used, while the
geostatistical maps correspond to a stochastic image of the reservoir.
A geostatistical analysis was performed using 42 well control points to
calculate structural tops, gross thickness, net-to-gross ratio, and porosity. A
cross-plot between porosity and core permeability yielded a relationship for
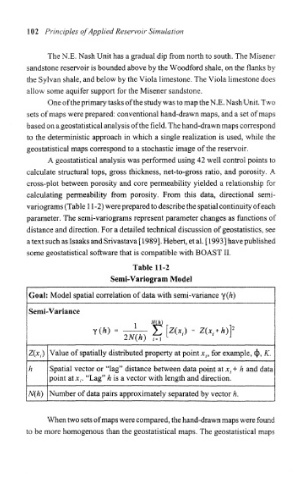
calculating permeability from porosity. From this data, directional semi-
variograms (Table 11 -2) were prepared to describe the spatial continuity of each
parameter. The semi-variograms represent parameter changes as functions of
distance and direction. For a detailed technical discussion of geostatistics, see
a text such as Isaaks and Srivastava [1989]. Hebert, et al. [1993] have published
some geostatistical software that is compatible with BOAST II.
Table 11-2
Semi-Variogram Model
Goal: Model spatial correlation of data with semi-variance y(h)
Semi-Variance
Value of spatially distributed property at point x it for example, (j),
Spatial vector or "lag" distance between data point at x t + h and data
point at x f. "Lag" A is a vector with length and direction.
N(h) Number of data pairs approximately separated by vector h.
When two sets of maps were compared, the hand-drawn maps were found
to be more homogenous than the geostatistical maps. The geostatistical maps