
Page 114 - Principles of Applied Reservoir Simulation 2E
P. 114
Part II: Reservoir Simulation 99
m
Z = Z 0 + Y h
m U fa*/ i
i=\
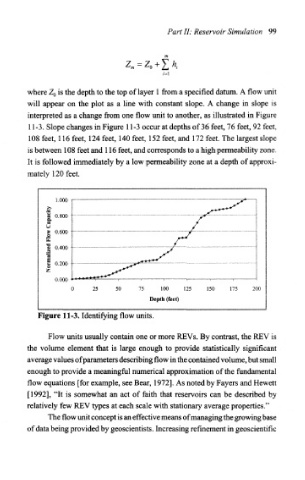
where Z 0 is the depth to the top of layer 1 from a specified datum. A flow unit
will appear on the plot as a line with constant slope. A change in slope is
interpreted as a change from one flow unit to another, as illustrated in Figure
11-3. Slope changes in Figure 11-3 occur at depths of 36 feet, 76 feet, 92 feet,
108 feet, 116 feet, 124 feet, 140 feet, 152 feet, and 172 feet. The largest slope
is between 108 feet and 116 feet, and corresponds to a high permeability zone.
It is followed immediately by a low permeability zone at a depth of approxi-
mately 120 feet.
1,000
Depth (feet)
Figure 11-3. Identifying flow units.
Flow units usually contain one or more REVs. By contrast, the REV is
the volume element that is large enough to provide statistically significant
average values of parameters describing flow in the contained volume, but small
enough to provide a meaningful numerical approximation of the fundamental
flow equations [for example, see Bear, 1972]. As noted by Payers and Hewett
[1992], "It is somewhat an act of faith that reservoirs can be described by
relatively few REV types at each scale with stationary average properties."
The flow unit concept is an effective means of managing the growing base
of data being provided by geoscientists. Increasing refinement in geoscientifk