
Page 118 - Principles of Applied Reservoir Simulation 2E
P. 118
Part II: Reservoir Simulation 103
exhibited the large-scale trends shown in the hand-drawn maps, but contained
more local variability. This was not surprising, since additional heterogeneity
is expected to arise as a result of geostatistical mapping.
The choice of final maps was based on management priorities: minimize
the risk of drilling a dry hole on the flanks of the field, and complete the study
before water breakthrough occurred in the remaining oil producers. The
geostatistical model satisfied both of these criteria. The main flow path in the
reservoir was narrower in the geostatistically generated maps than in the hand-
drawn maps, and the geostatistical realization could be modified in a day or two.
Once a set of maps was chosen, the history match process could begin.
Tracer information in the form of salinity changes was useful in helping identify
sources of injection water as the water was produced. This was valuable in
defining flow channels that could not otherwise be inferred. In some areas,
transmissibility and porosity changes were needed to match water cut and
reservoir pressure.
The geostatistical realization used in the N.E. Nash study was just a single
realization. It was selected because it satisfied constraints imposed by previous
volumetric and material balance studies. If these constraints were not available
or were less reliable, which would be the case early in the life of a field, a
geostatistical study would require the use of multiple realizations to characterize
the reservoir. This raises the question of how many realizations are necessary.
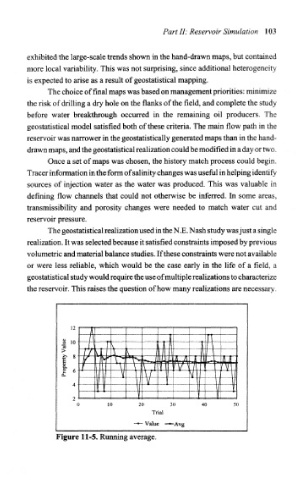
Value —*-Avg
Figure 11-5. Running average.