
Page 185 - Principles of Applied Reservoir Simulation 2E
P. 185
170 Principles of Applied Reservoir Simulation
or data from analogous fields will have to be used. Values must be entered into
the simulator, and it is prudent to select values that can be justified.
Well data should be reviewed. If additional field tests are needed, they
should be requested and incorporated into the study schedule. Due to the costs
and operating constraints of a project, it may be difficult to justify the expense
of acquiring more data or delaying the study while additional data is obtained.
The modeling team should take care to avoid underestimating the amount of
work that may be needed to prepare an input data set. It can take as long to
collect and prepare the data as it does to do the study.
17.2 Pressure Correction
When pressures are matched in a model study, the calculated and observed
pressures should be compared at a common datum. In addition, pressures from
well tests should be corrected for comparison with model block pressures. A
widely used pressure correction is the Peaceman [1978, 1983] correction.
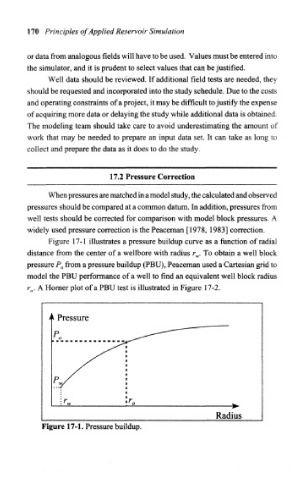
Figure 17-1 illustrates a pressure buildup curve as a function of radial
distance from the center of a wellbore with radius r w. To obtain a well block
pressure P 0 from a pressure buildup (PBU), Peaceman used a Cartesian grid to
model the PBU performance of a well to find an equivalent well block radius
r 0. A Homer plot of a PBU test is illustrated in Figure 17-2.
Radius
Figure 17-1. Pressure buildup.