
Page 295 - Principles of Applied Reservoir Simulation 2E
P. 295
280 Principles of Applied Reservoir Simulation
producing fluid rates. Consequently these ratios are comparable to observed
fieldwide ratios.
The output quantities include: cumulative production of oil, water and
gas; cumulative injection of water and gas; pore volume weighted average
pressure; aquifer influx rate and cumulative aquifer influx; and fieldwide WOR
and GOR values. These quantities are output as functions of time and timestep
number.
26.2.3 Well Report File - WTEMP.WEL
Rates and cumulative production/injection data for each layer of each well
are summarized in the well report at times you specify. Field totals are also
included.
26.2.4 Distribution Arrays File - WTEMP.ROF
You may output the following arrays whenever desired: pressure,
saturations, bubble point pressure, cumulative aquifer influx, eompressional
velocity, acoustic impedance, and seismic reflection coefficient. Output arrays
may be used as input pressure and saturation distributions for restarting a run.
It is usually unnecessary to print all of the arrays. To avoid excessive
output and correspondingly large output files, you should be judicious in
deciding which arrays are printed. In addition to arrays, you may wish to output
digital contour plots.
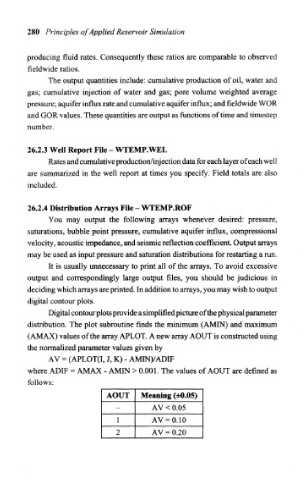
Digital contour plots provide a simplified picture of the physical parameter
distribution. The plot subroutine finds the minimum (AMIN) and maximum
(AMAX) values of the array APLOT. A new array AOUT is constructed using
the normalized parameter values given by
AV = (APLOT(I, J, K) - AMIN)/ADIF
where ADIF = AMAX - AMIN > 0.001. The values of AOUT are defined as
follows:
AOUT Meaning (±0.05)
- AV<0.05
1 AV = 0.10
2 AV = 0.20