
Page 296 - Principles of Applied Reservoir Simulation 2E
P. 296
Part IV: WINB4D User's Manual 281
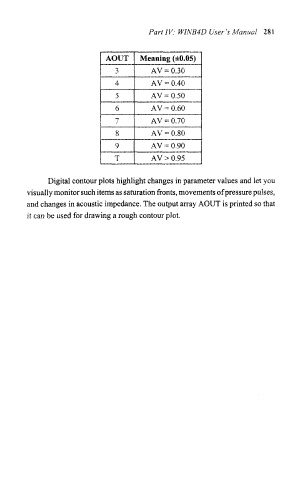
AOUT Meaning (±0.05)
3 AV = 0.30
4 AV = 0.40
5 AV = 0.50
6 AV = 0.60
7 AV = 0.70
8 AV = 0.80
9 AV = 0.90
T AV > 0.95
Digital contour plots highlight changes in parameter values and let you
visually monitor such items as saturation fronts, movements of pressure pulses,
and changes in acoustic impedance. The output array AOUT is printed so that
it can be used for drawing a rough contour plot.