
Page 199 - Principles of Catalyst Development
P. 199
188 CHAPTER 8
catalyst must be either replaced or regenerated. Regeneration is a treatment
in which activity is returned. In practice, initial activity is not always restored,
due to a small permanent secondary deactivation. Further processing con-
tinues for another cycle, until regeneration is necessary again. Finally,
regeneration becomes unproductive, and catalyst replacement is indicated.
A sudden change in deactivation rate is seen when catastrophic upsets
occur. This may be caused by unit malfunction, error, or unexpected changes
in feed properties. Many models have been used to predict deactivation
rates, but the most general and useful is the decay law(258)
(8.2)
where A is activity, k and n constants that depend on process conditions
and mechanisms. Equation (8.2) integrates to
A = AoO + bt)m (8.3 )
n
where m = 1/(1- n) and b = (1- n)k/A6- •
For large enough process times bt » 1 and
log A = m log b + m log t (8.4 )
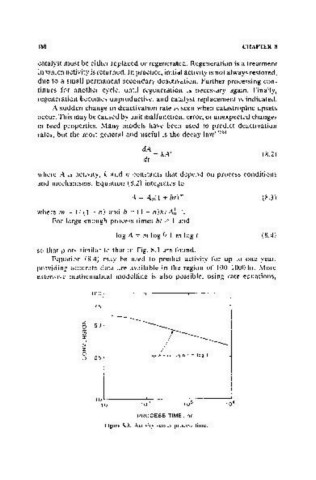
so that plots similar to that in Fig. 8.3 are found.
Equation (8.4) may be used to predict activity for up to one year,
providing accurate data are available in the region of 100-1000 hr. More
extensive mathematical modelling is also possible, using rate equations,
100r---------,----------,----------,
75
----
~ 50
iii
a:
w
>
z
o log A; m log b + m log I
o 25
PROCESS TIME. hr
Figure 11.3. Activity versus process time.