
Page 197 - Principles of Catalyst Development
P. 197
186 CHAPTER 8
of the other parameters. This is an oversimplification, since Nt may also
be changed by the deactivating process, yet it serves a useful model for
discussion. For the present, we shal1 consider only the effect of loss of total
activity as measured by the rate or some derivative such as rate constant,
conversion, and so on.
In laboratory measurements, deactivation is troublesome and mis-
leading if not identified. A clean catalyst surface begins to deactivate as
soon as it encounters reactant molecules. Usually, this initial phase is so
fast that it may not be observed by the time the first measurement is made.
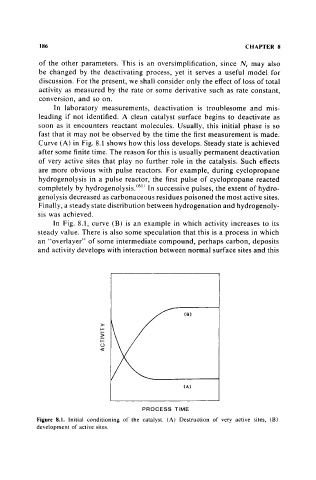
Curve (A) in Fig. 8.1 shows how this loss develops. Steady state is achieved
after some finite time. The reason for this is usually permanent deactivation
of very active sites that play no further role in the catalysis. Such effects
are more obvious with pulse reactors. For example, during cyclopropane
hydrogenolysis in a pulse reactor, the first pulse of cyclopropane reacted
completely by hydrogenolysis. (611 In successive pulses, the extent of hydro-
genolysis decreased as carbonaceous residues poisoned the most active sites.
Final1y, a steady state distribution between hydrogenation and hydrogenoly-
sis was achieved.
In Fig. 8.1, curve (B) is an example in which activity increases to its
steady value. There is also some speculation that this is a process in which
an "overlayer" of some intermediate compound, perhaps carbon, deposits
and activity develops with interaction between normal surface sites and this
(8)
>
I-
>
I-
U
ct
(A)
PROCESS TIME
Figure 8.1. Initial conditioning of the catalyst. (A) Destruction of very active sites, (B)
development of active sites.