
Page 182 - Probability Demystified
P. 182
CHAPTER 9 The Normal Distribution 171
Fig. 9-21.
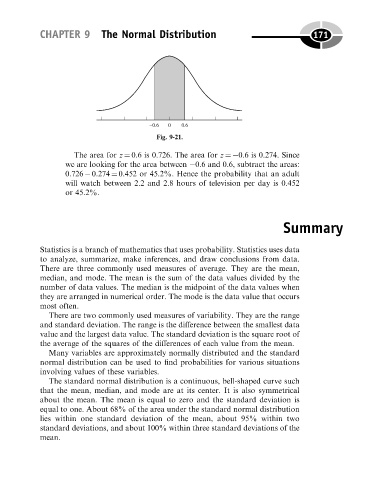
The area for z ¼ 0.6 is 0.726. The area for z ¼ 0.6 is 0.274. Since
we are looking for the area between 0.6 and 0.6, subtract the areas:
0.726 0.274 ¼ 0.452 or 45.2%. Hence the probability that an adult
will watch between 2.2 and 2.8 hours of television per day is 0.452
or 45.2%.
Summary
Statistics is a branch of mathematics that uses probability. Statistics uses data
to analyze, summarize, make inferences, and draw conclusions from data.
There are three commonly used measures of average. They are the mean,
median, and mode. The mean is the sum of the data values divided by the
number of data values. The median is the midpoint of the data values when
they are arranged in numerical order. The mode is the data value that occurs
most often.
There are two commonly used measures of variability. They are the range
and standard deviation. The range is the difference between the smallest data
value and the largest data value. The standard deviation is the square root of
the average of the squares of the differences of each value from the mean.
Many variables are approximately normally distributed and the standard
normal distribution can be used to find probabilities for various situations
involving values of these variables.
The standard normal distribution is a continuous, bell-shaped curve such
that the mean, median, and mode are at its center. It is also symmetrical
about the mean. The mean is equal to zero and the standard deviation is
equal to one. About 68% of the area under the standard normal distribution
lies within one standard deviation of the mean, about 95% within two
standard deviations, and about 100% within three standard deviations of the
mean.