Page 483 - Probability and Statistical Inference
P. 483

460    9. Confidence Interval Estimation

                                 9.3.2   Comparing the Scale Parameters

                                 The examples include estimation of the ratio of (i) the variances of two inde-
                                 pendent normal populations, (ii) the scale parameters of two independent nega-
                                 tive exponential populations, and (iii) the scale parameters of two independent
                                 uniform populations.
                                    Example 9.3.4 Ratio of Normal Variances: Recall the Example 4.5.3 as
                                 needed. Suppose that the random variables X , ..., X  are iid    n  ≥
                                                                                                i
                                                                             ini
                                                                       i1
                                 2, i = 1, 2, and that the X ’s are independent of the X ’s. We assume that all
                                                                              2j
                                                      1j
                                 four parameters are unknown and (µ , σ ) ∈ ℜ × ℜ , i = 1, 2. With fixed α ∈
                                                                            +
                                                                i
                                                                  i
                                 (0, 1), we wish to construct a (1 – α) two-sided confidence interval for
                                       based on the sufficient statistics for θ(= (µ , µ , σ , σ )). Let us denote
                                                                          1  2  1  2
                                 for i = 1, 2 and consider the pivot
                                 It should be clear that U is distributed as F n1–1,n2–1  since (n  – 1)     is
                                                                                     i
                                 distributed as    i = 1, 2, and these are also independent. As before, let us
                                 denote the upper 100(α/2)% point of the F n1–1,n2–1  distribution by F n1–1,n2–1,α/
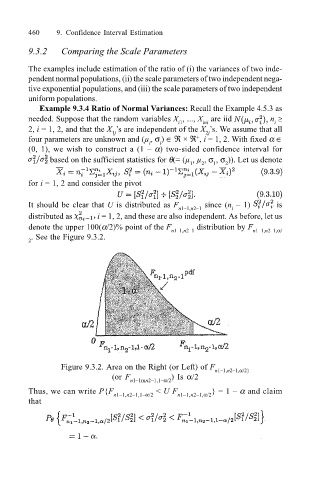
                                  . See the Figure 9.3.2.
                                 2


                                         Figure 9.3.2. Area on the Right (or Left) of F n1–1,n2–1,α/2}
                                                      (or F          ) Is  α/2
                                                           n1–1mn2–1,1–α/2
                                 Thus, we can write P{F n1–1,n2–1,1–α/2  < U F n1–1,n2–1,α/2 } = 1 – α and claim
                                 that
   478   479   480   481   482   483   484   485   486   487   488