
Page 550 - Probability and Statistical Inference
P. 550
11. Likehood Ratio and Other Tests 527
Figure 11.4.5. Upper-Sided Students t Rejection Region
n-2
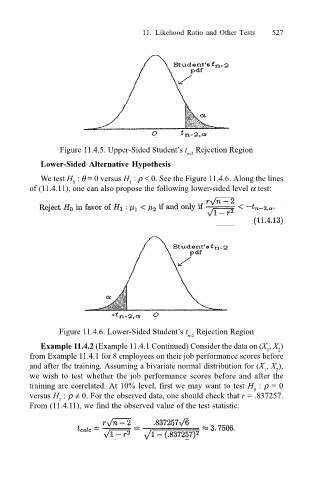
Lower-Sided Alternative Hypothesis
We test H : θ = 0 versus H : ρ < 0. See the Figure 11.4.6. Along the lines
1
0
of (11.4.11), one can also propose the following lower-sided level α test:
Figure 11.4.6. Lower-Sided Students t Rejection Region
n-2
Example 11.4.2 (Example 11.4.1 Continued) Consider the data on (X , X )
1
2
from Example 11.4.1 for 8 employees on their job performance scores before
and after the training. Assuming a bivariate normal distribution for (X , X ),
1
2
we wish to test whether the job performance scores before and after the
training are correlated. At 10% level, first we may want to test H : ρ = 0
0
versus H : ρ ≠ 0. For the observed data, one should check that r = .837257.
1
From (11.4.11), we find the observed value of the test statistic: