
Page 262 - Process Equipment and Plant Design Principles and Practices by Subhabrata Ray Gargi Das
P. 262
10.3 Packed column 263
packing above the minimum irrigation rate. The operation, in this case, is carried out at or above a
3 2
“minimum wetting rate” computed as q L =a where q L is the volumetric liquid flow rate in m /(hr.m )
3
2
of tower cross-section, and a is the packing surface area in m /m .
10.3.1 Packed column design based on mass transfer coefficient
The rate of mass transfer in the column depends on the concentration difference driving force across the
interphase, the liquid-phaseandgas-phasemass transfer coefficients(k x ,k y ), and the interfacial area a for
mass transfer provided by the packing. Active volume of packing required to achieve the design target
of concentration change, say, from y 1 (or x 2 )to y 2 (or x 1 ) of a stream depends on the volumetric mass
transfer coefficient, which is the mass transfer coefficient (k x ,k y ) times the interfacial area (a) per unit
3
2
volume of the packing (m /m bed). A higher volumetric mass transfer coefficient requires a lower bed
volume. As the bed diameter is (primarily) decided by the flooding considerations at the design liquid
and the gas flow rates, the bed height is lower when the volumetric mass transfer coefficient is higher.
Procedure to estimate the height of the active section of an absorber bed needed to achieve a given
separation uses (i) rate expression for representing interphase mass transfer and (ii) material balance to
represent the change in the composition of the two phases. The rate expression involves the interphase
mass transfer coefficients. Combining these expressions leads to an integral expression for the number
of transfer units that is very similar and closely related to equations for the number of theoretical
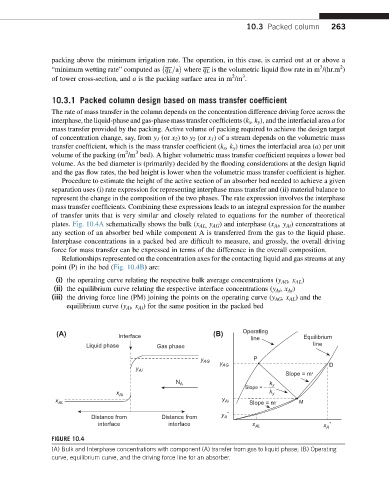
plates. Fig. 10.4A schematically shows the bulk (x AL, y AG ) and interphase (x Ai ,y Ai ) concentrations at
any section of an absorber bed while component A is transferred from the gas to the liquid phase.
Interphase concentrations in a packed bed are difficult to measure, and grossly, the overall driving
force for mass transfer can be expressed in terms of the difference in the overall composition.
Relationships represented on the concentration axes for the contacting liquid and gas streams at any
point (P) in the bed (Fig. 10.4B) are:
(i) the operating curve relating the respective bulk average concentrations (y AG ,x AL )
(ii) the equilibrium curve relating the respective interface concentrations (y Ai ,x Ai )
(iii) the driving force line (PM) joining the points on the operating curve (y AG ,x AL ) and the
equilibrium curve (y Ai ,x Ai ) for the same position in the packed bed
(A) Interface (B) Operating Equilibrium
line
Liquid phase Gas phase line
P
y AG
y AG D
y Ai
Slope = m"
k
N A x
Slope = –
x Ai k y
x AL y Ai Slope = m' M
y *
Distance from Distance from A
interface interface x AL x A *
FIGURE 10.4
(A) Bulk and Interphase concentrations with component (A) transfer from gas to liquid phase; (B) Operating
curve, equilibrium curve, and the driving force line for an absorber.