
Page 294 - Process Equipment and Plant Design Principles and Practices by Subhabrata Ray Gargi Das
P. 294
296 Chapter 11 Distillation
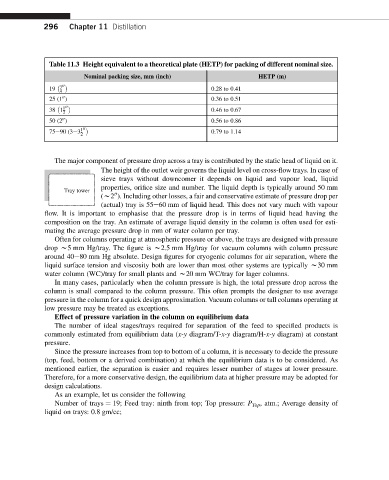
Table 11.3 Height equivalent to a theoretical plate (HETP) for packing of different nominal size.
Nominal packing size, mm (inch) HETP (m)
3
00
19 0.28 to 0.41
4
25 (1 ) 0.36 to 0.51
00
38 1 1 00 0.46 to 0.67
2
50 (2 ) 0.56 to 0.86
00
75e90 (3e3 1 00 0.79 to 1.14
2
The major component of pressure drop across a tray is contributed by the static head of liquid on it.
The height of the outlet weir governs the liquid level on cross-flow trays. In case of
sieve trays without downcomer it depends on liquid and vapour load, liquid
properties, orifice size and number. The liquid depth is typically around 50 mm
Tray tower
(w2 ). Including other losses, a fair and conservative estimate of pressure drop per
00
(actual) tray is 55e60 mm of liquid head. This does not vary much with vapour
flow. It is important to emphasise that the pressure drop is in terms of liquid head having the
composition on the tray. An estimate of average liquid density in the column is often used for esti-
mating the average pressure drop in mm of water column per tray.
Often for columns operating at atmospheric pressure or above, the trays are designed with pressure
drop w5 mm Hg/tray. The figure is w2.5 mm Hg/tray for vacuum columns with column pressure
around 40e80 mm Hg absolute. Design figures for cryogenic columns for air separation, where the
liquid surface tension and viscosity both are lower than most other systems are typically w30 mm
water column (WC)/tray for small plants and w20 mm WC/tray for lager columns.
In many cases, particularly when the column pressure is high, the total pressure drop across the
column is small compared to the column pressure. This often prompts the designer to use average
pressure in the column for a quick design approximation. Vacuum columns or tall columns operating at
low pressure may be treated as exceptions.
Effect of pressure variation in the column on equilibrium data
The number of ideal stages/trays required for separation of the feed to specified products is
commonly estimated from equilibrium data (x-y diagram/T-x-y diagram/H-x-y diagram) at constant
pressure.
Since the pressure increases from top to bottom of a column, it is necessary to decide the pressure
(top, feed, bottom or a derived combination) at which the equilibrium data is to be considered. As
mentioned earlier, the separation is easier and requires lesser number of stages at lower pressure.
Therefore, for a more conservative design, the equilibrium data at higher pressure may be adopted for
design calculations.
As an example, let us consider the following
Number of trays ¼ 19; Feed tray: ninth from top; Top pressure: P Top , atm.; Average density of
liquid on trays: 0.8 gm/cc;