
Page 357 - Process Equipment and Plant Design Principles and Practices by Subhabrata Ray Gargi Das
P. 357
12.2 Packed bed adsorption 359
(A)
Equilibrium Mass
Feed zone transfer Active zone Effluent
C i zone
(B)
1
t C* t t
C/C i t 1 2 3 4
C i
0
Distance along bed (z)
Concentration in fluid phase are shown
, t , t , t
at time instants t 1 2 3 4
FIGURE 12.3
(A) Zones in packed bed during adsorption (at time instant t 2 ); (B) Solute concentration profiles in the fluid
phase with progress of time (c is equilibrium concentration).
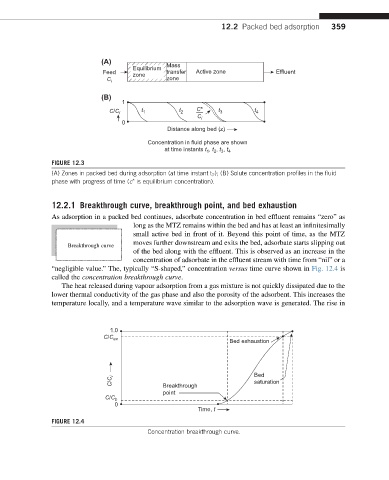
12.2.1 Breakthrough curve, breakthrough point, and bed exhaustion
As adsorption in a packed bed continues, adsorbate concentration in bed effluent remains “zero” as
long as the MTZ remains within the bed and has at least an infinitesimally
small active bed in front of it. Beyond this point of time, as the MTZ
moves further downstream and exits the bed, adsorbate starts slipping out
Breakthrough curve
of the bed along with the effluent. This is observed as an increase in the
concentration of adsorbate in the effluent stream with time from “nil” or a
“negligible value.” The, typically “S-shaped,” concentration versus time curve shown in Fig. 12.4 is
called the concentration breakthrough curve.
The heat released during vapour adsorption from a gas mixture is not quickly dissipated due to the
lower thermal conductivity of the gas phase and also the porosity of the adsorbent. This increases the
temperature locally, and a temperature wave similar to the adsorption wave is generated. The rise in
1.0
C/C ex
Bed exhaustion
Bed
C/C i Breakthrough saturation
point
C/C b
0
Time, t
FIGURE 12.4
Concentration breakthrough curve.