Page 358 - Process Equipment and Plant Design Principles and Practices by Subhabrata Ray Gargi Das
P. 358
360 Chapter 12 Adsorption
temperature at the fluid outlet can thus be used as a rough indication of breakthrough point.
The temperature rise is relatively small for liquid adsorption as the heat gets more easily dissipated.
The onset of presence of adsorbate in the effluent is the ideal “breakthrough point.” However, in
practice, the effluent stream is inevitably used in a downstream process
and the maximum allowable solute concentration in the stream acceptable
by the said process is the “breakthrough concentration” considered in bed
Breakthrough point
design. Operation beyond the breakthrough concentration renders the
effluent stream unacceptable for the downstream process.
Operation beyond the breakthrough point continuously increases the concentration in the effluent
stream, and finally, the entire bed gets fully “exhausted.” No further adsorp-
tion takes place in this condition, and the effluent stream concentration is
close to the feed stream concentration. In practice, the bed is considered
Bed exhaustion
exhausted when the effluent concentration is around 95% of the feed
concentration. One may also note that when some very strongly adsorbed
components are present in feed stream along with a mixture of less strongly
adsorbed components, the effluent concentration may not attain the feed concentration as only the
components that move fast through the bed, are in the breakthrough curve.
Shape of the breakthrough curve strongly depends on
(i) Rate and mechanism of the adsorption process
(ii) Nature of adsorption equilibrium (a flat isotherm indicates a narrow MTZ and a steep
breakthrough curve)
(iii) Fluid velocity; Concentration of adsorbate in feed
(iv) Mass transfer kinetics: fast kinetics implies a steep breakthrough curve while slow kinetics
results in a distended shape.
Slow kinetics may be tackled by increasing cycle time and also by using smaller adsorbent par-
ticles, but the designer needs to consider that increased cycle time requires a higher inventory of
adsorbent and smaller particles entail higher pressure drop.
Breakthrough capacity (BC) of a bed is the mass of adsorbate held per unit mass of adsorbent at the
point of breakthrough, and this clearly depends
on the breakthrough concentration (c b ,) at
breakthrough time (t b )(Fig. 12.4) considered by
Breakthrough capacity and Saturation capacity
the designer. Similarly, the saturation capacity of
the bed (SC) is the maximum loading of adsor-
bate when the entire bed is fully saturated and is
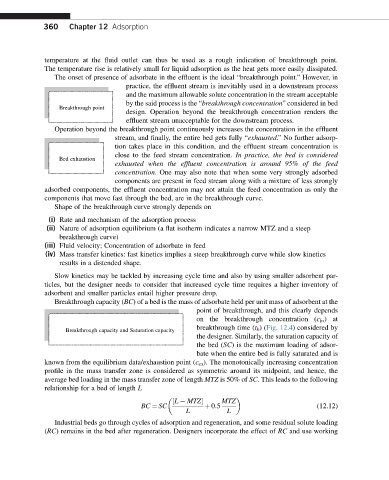
known from the equilibrium data/exhaustion point (c ex ). The monotonically increasing concentration
profile in the mass transfer zone is considered as symmetric around its midpoint, and hence, the
average bed loading in the mass transfer zone of length MTZ is 50% of SC. This leads to the following
relationship for a bed of length L
½L MTZ MTZ
BC ¼ SC þ 0:5 (12.12)
L L
Industrial beds go through cycles of adsorption and regeneration, and some residual solute loading
(RC) remains in the bed after regeneration. Designers incorporate the effect of RC and use working

