
Page 359 - Process Equipment and Plant Design Principles and Practices by Subhabrata Ray Gargi Das
P. 359
12.2 Packed bed adsorption 361
capacity WC as a measure of the actual adsorption capacity of the bed. If experimental data is
available, WC may be estimated as
½L MTZ MTZ
WC ¼ SC þ 0:5 RC (12.13)
L L
In the absence of data WC is taken as a fraction of SC as
WC ¼ SC f (12.14)
Typical value of f may be 0.85e0.9.
During operation, the adsorption step is terminated slightly before the breakthrough point. This
ensures that the effluent always remains “on-spec.”
In planning new processes, it is best to determine the breakthrough point and breakthrough curve
for a particular system experimentally under conditions as close as possible to the process conditions.
12.2.2 Desorption/regeneration
The saturated adsorbent is either regenerated or disposed off. Disposal may be considered as an option
when (1) adsorbent cost is low, (2) regeneration is very difficult/expensive, (3) nonadsorbed compo-
nent is a very high value desired product, (4) chemisorption occurs and reversibility is impractical. In
most applications, disposal is uneconomic, and adsorbent is regenerated for reuse either in-situ or in a
separate process. The environmental effect of the disposed adsorbent is also a concern for the designer.
Gas-phase adsorption
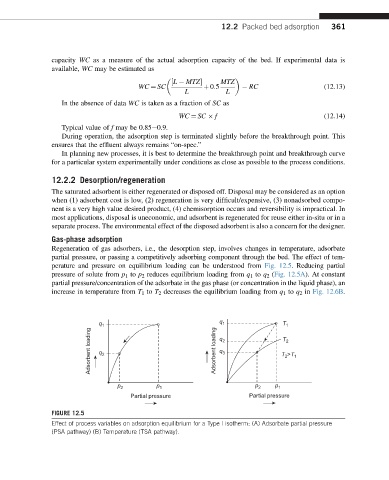
Regeneration of gas adsorbers, i.e., the desorption step, involves changes in temperature, adsorbate
partial pressure, or passing a competitively adsorbing component through the bed. The effect of tem-
perature and pressure on equilibrium loading can be understood from Fig. 12.5. Reducing partial
pressure of solute from p 1 to p 2 reduces equilibrium loading from q 1 to q 2 (Fig. 12.5A). At constant
partial pressure/concentration of the adsorbate in the gas phase (or concentration in the liquid phase), an
increase in temperature from T 1 to T 2 decreases the equilibrium loading from q 1 to q 2 in Fig. 12.6B.
q 1 q 1 T 1
Adsorbent loading q 2 Adsorbent loading q q 2 3 T >T 1
T 2
2
p
p 2 p 1 p 2 1
Partial pressure Partial pressure
FIGURE 12.5
Effect of process variables on adsorption equilibrium for a Type I isotherm: (A) Adsorbate partial pressure
(PSA pathway) (B) Temperature (TSA pathway).