Page 210 - Process Modelling and Simulation With Finite Element Methods
P. 210

Simulation and Nonlinear Dynamics         197

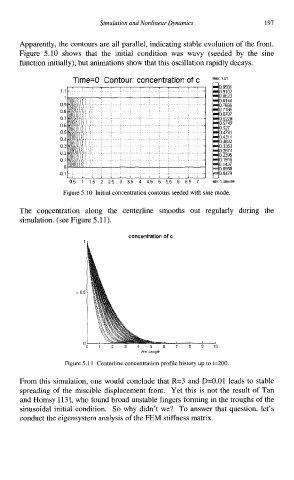
          Apparently, the contours are all parallel, indicating stable evolution of the front.
          Figure  5.10 shows  that  the  initial  condition  was  wavy  (seeded  by  the  sine
          function initially), but animations show that this oscillation rapidly decays.
                       Time=O Contour: concentration of c   Max  1 01
                                                            0 9581
                    11                                      0 9102
                     1                                      0 8623
                                                            0 8144
                    09                                      0 7665
                    08                                      0 7186
                                                            0 6707
                    07                                      0 6228
                    06                                      0 5749
                                                            0 527
                    05                                      0 4791
                    04                                      04311
                                                            0 3832
                    03                                      0 3353
                    02                                      0 2874
                                                            0 2395
                    01                                      0 1916
                     0                                      0 1437
                                                            0 0958
                    01                                      0 0479
                      05  1  15  2  25  3  35  4  45  5  55  6  65  7   MI"  198e-04'
                     Figure 5.10 Initial concentration contours seeded with sine mode.
          The  concentration  along  the  centerline  smooths  out  regularly  during  the
          simulation. (see Figure 5.1  1).
                                     concentration of c


                                         Arc Length
                     Figure 5.1 1  Centerline concentration profile history up to t=200
          From this simulation, one would conclude that R=3 and D=0.01 leads to stable
          spreading of  the miscible displacement front.  Yet this is not the result of  Tan
          and Homsy [13], who found broad unstable fingers forming in the troughs of the
          sinusoidal  initial condition.  So why didn't  we?  To answer that question, let's
          conduct the eigensystem analysis of the FEM stiffness matrix.
   205   206   207   208   209   210   211   212   213   214   215