
Page 82 - Process Modelling and Simulation With Finite Element Methods
P. 82
Partial Differential Equations and the Finite Element Method 69
Pull down the Point menu and select View as Coefficients.
Point ModeICoefficient View
Click on the origin
Select point 3
Select the weak tab
Enter u-test
Apply/OK
Click on the triangle on the toolbar to re-mesh (592 elements).
Now pull down the Solve menu and select the Parameters option.
Solver Parameters
Select stationary linear
Solution form: weak
Solve
0 Cancel
OK
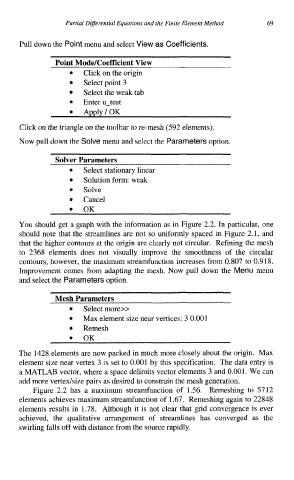
You should get a graph with the information as in Figure 2.2. In particular, one
should note that the streamlines are not so uniformly spaced in Figure 2.1, and
that the higher contours at the origin are clearly not circular. Refining the mesh
to 2368 elements does not visually improve the smoothness of the circular
contours, however, the maximum streamfunction increases from 0.807 to 0.91 8.
Improvement comes from adapting the mesh. Now pull down the Menu menu
and select the Parameters option.
Mesh Parameters
Select more>>
Max element size near vertices: 3 0.001
Remesh
OK
The 1428 elements are now packed in much more closely about the origin. Max
element size near vertex 3 is set to 0.001 by this specification. The data entry is
a MATLAB vector, where a space delimits vector elements 3 and 0.001. We can
add more vertedsize pairs as desired to constrain the mesh generation.
Figure 2.2 has a maximum streamfunction of 1.56. Remeshing to 5712
elements achieves maximum streamfunction of 1.67. Remeshing again to 22848
elements results in 1.78. Although it is not clear that grid convergence is ever
achieved, the qualitative arrangement of streamlines has converged as the
swirling falls off with distance from the source rapidly.