
Page 103 -
P. 103
3.6 Quality of Resulting Models 85
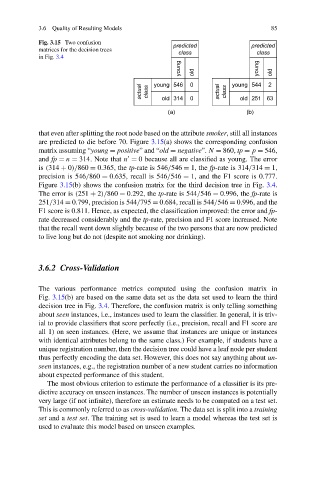
Fig. 3.15 Two confusion
matrices for the decision trees
in Fig. 3.4
that even after splitting the root node based on the attribute smoker, still all instances
are predicted to die before 70. Figure 3.15(a) shows the corresponding confusion
matrix assuming “young = positive” and “old = negative”. N = 860, tp = p = 546,
and fp = n = 314. Note that n = 0 because all are classified as young. The error
is (314 + 0)/860 = 0.365, the tp-rate is 546/546 = 1, the fp-rate is 314/314 = 1,
precision is 546/860 = 0.635, recall is 546/546 = 1, and the F1 score is 0.777.
Figure 3.15(b) shows the confusion matrix for the third decision tree in Fig. 3.4.
The error is (251 + 2)/860 = 0.292, the tp-rate is 544/546 = 0.996, the fp-rate is
251/314 = 0.799, precision is 544/795 = 0.684, recall is 544/546 = 0.996, and the
F1 score is 0.811. Hence, as expected, the classification improved: the error and fp-
rate decreased considerably and the tp-rate, precision and F1 score increased. Note
that the recall went down slightly because of the two persons that are now predicted
to live long but do not (despite not smoking nor drinking).
3.6.2 Cross-Validation
The various performance metrics computed using the confusion matrix in
Fig. 3.15(b) are based on the same data set as the data set used to learn the third
decision tree in Fig. 3.4. Therefore, the confusion matrix is only telling something
about seen instances, i.e., instances used to learn the classifier. In general, it is triv-
ial to provide classifiers that score perfectly (i.e., precision, recall and F1 score are
all 1) on seen instances. (Here, we assume that instances are unique or instances
with identical attributes belong to the same class.) For example, if students have a
unique registration number, then the decision tree could have a leaf node per student
thus perfectly encoding the data set. However, this does not say anything about un-
seen instances, e.g., the registration number of a new student carries no information
about expected performance of this student.
The most obvious criterion to estimate the performance of a classifier is its pre-
dictive accuracy on unseen instances. The number of unseen instances is potentially
very large (if not infinite), therefore an estimate needs to be computed on a test set.
This is commonly referred to as cross-validation. The data set is split into a training
set and a test set. The training set is used to learn a model whereas the test set is
used to evaluate this model based on unseen examples.