
Page 105 -
P. 105
3.6 Quality of Resulting Models 87
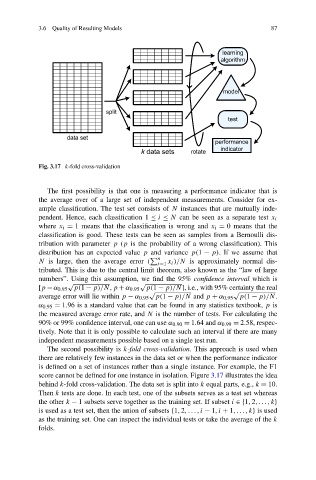
Fig. 3.17 k-fold cross-validation
The first possibility is that one is measuring a performance indicator that is
the average over of a large set of independent measurements. Consider for ex-
ample classification. The test set consists of N instances that are mutually inde-
pendent. Hence, each classification 1 ≤ i ≤ N can be seen as a separate test x i
where x i = 1 means that the classification is wrong and x i = 0 means that the
classification is good. These tests can be seen as samples from a Bernoulli dis-
tribution with parameter p (p is the probability of a wrong classification). This
distribution has an expected value p and variance p(1 − p). If we assume that
n
x
N is large, then the average error ( i=1 i )/N is approximately normal dis-
tributed. This is due to the central limit theorem, also known as the “law of large
numbers”. Using this assumption, we find the 95% confidence interval which is
√ √
[p − α 0.95 p(1 − p)/N,p + α 0.95 p(1 − p)/N], i.e., with 95% certainty the real
√ √
average error will lie within p − α 0.95 p(1 − p)/N and p + α 0.95 p(1 − p)/N.
α 0.95 = 1.96 is a standard value that can be found in any statistics textbook, p is
the measured average error rate, and N is the number of tests. For calculating the
90% or 99% confidence interval, one can use α 0.90 = 1.64 and α 0.99 = 2.58, respec-
tively. Note that it is only possible to calculate such an interval if there are many
independent measurements possible based on a single test run.
The second possibility is k-fold cross-validation. This approach is used when
there are relatively few instances in the data set or when the performance indicator
is defined on a set of instances rather than a single instance. For example, the F1
score cannot be defined for one instance in isolation. Figure 3.17 illustrates the idea
behind k-fold cross-validation. The data set is split into k equal parts, e.g., k = 10.
Then k tests are done. In each test, one of the subsets serves as a test set whereas
the other k − 1 subsets serve together as the training set. If subset i ∈{1,2,...,k}
is used as a test set, then the union of subsets {1,2,...,i − 1,i + 1,...,k} is used
as the training set. One can inspect the individual tests or take the average of the k
folds.