
Page 104 -
P. 104
86 3 Data Mining
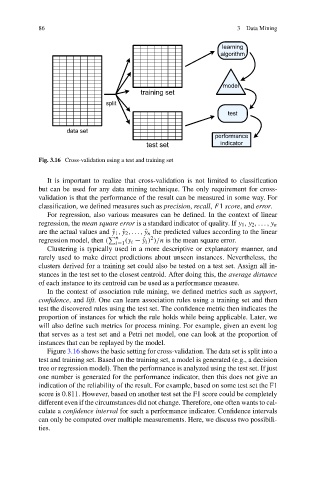
Fig. 3.16 Cross-validation using a test and training set
It is important to realize that cross-validation is not limited to classification
but can be used for any data mining technique. The only requirement for cross-
validation is that the performance of the result can be measured in some way. For
classification, we defined measures such as precision, recall, F1 score, and error.
For regression, also various measures can be defined. In the context of linear
regression, the mean square error is a standard indicator of quality. If y 1 ,y 2 ,...,y n
are the actual values and ˆy 1 , ˆy 2 ,..., ˆy n the predicted values according to the linear
n 2
regression model, then ( i=1 (y i −ˆy i ) )/n is the mean square error.
Clustering is typically used in a more descriptive or explanatory manner, and
rarely used to make direct predictions about unseen instances. Nevertheless, the
clusters derived for a training set could also be tested on a test set. Assign all in-
stances in the test set to the closest centroid. After doing this, the average distance
of each instance to its centroid can be used as a performance measure.
In the context of association rule mining, we defined metrics such as support,
confidence, and lift. One can learn association rules using a training set and then
test the discovered rules using the test set. The confidence metric then indicates the
proportion of instances for which the rule holds while being applicable. Later, we
will also define such metrics for process mining. For example, given an event log
that serves as a test set and a Petri net model, one can look at the proportion of
instances that can be replayed by the model.
Figure 3.16 shows the basic setting for cross-validation. The data set is split into a
test and training set. Based on the training set, a model is generated (e.g., a decision
tree or regression model). Then the performance is analyzed using the test set. If just
one number is generated for the performance indicator, then this does not give an
indication of the reliability of the result. For example, based on some test set the F1
score is 0.811. However, based on another test set the F1 score could be completely
different even if the circumstances did not change. Therefore, one often wants to cal-
culate a confidence interval for such a performance indicator. Confidence intervals
can only be computed over multiple measurements. Here, we discuss two possibili-
ties.