
Page 342 -
P. 342
324 13 Cartography and Navigation
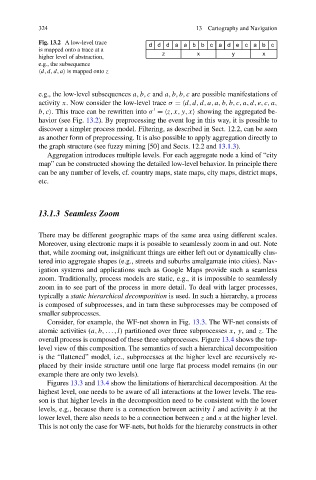
Fig. 13.2 A low-level trace
is mapped onto a trace at a
higher level of abstraction,
e.g., the subsequence
d,d,d,a is mapped onto z
e.g., the low-level subsequences a,b,c and a,b,b,c are possible manifestations of
activity x. Now consider the low-level trace σ = d,d,d,a,a,b,b,c,a,d,e,c,a,
b,c . This trace can be rewritten into σ = z,x,y,x showing the aggregated be-
havior (see Fig. 13.2). By preprocessing the event log in this way, it is possible to
discover a simpler process model. Filtering, as described in Sect. 12.2, can be seen
as another form of preprocessing. It is also possible to apply aggregation directly to
the graph structure (see fuzzy mining [50] and Sects. 12.2 and 13.1.3).
Aggregation introduces multiple levels. For each aggregate node a kind of “city
map” can be constructed showing the detailed low-level behavior. In principle there
can be any number of levels, cf. country maps, state maps, city maps, district maps,
etc.
13.1.3 Seamless Zoom
There may be different geographic maps of the same area using different scales.
Moreover, using electronic maps it is possible to seamlessly zoom in and out. Note
that, while zooming out, insignificant things are either left out or dynamically clus-
tered into aggregate shapes (e.g., streets and suburbs amalgamate into cities). Nav-
igation systems and applications such as Google Maps provide such a seamless
zoom. Traditionally, process models are static, e.g., it is impossible to seamlessly
zoom in to see part of the process in more detail. To deal with larger processes,
typically a static hierarchical decomposition is used. In such a hierarchy, a process
is composed of subprocesses, and in turn these subprocesses may be composed of
smaller subprocesses.
Consider, for example, the WF-net shown in Fig. 13.3. The WF-net consists of
atomic activities (a,b,...,l) partitioned over three subprocesses x, y, and z.The
overall process is composed of these three subprocesses. Figure 13.4 shows the top-
level view of this composition. The semantics of such a hierarchical decomposition
is the “flattened” model, i.e., subprocesses at the higher level are recursively re-
placed by their inside structure until one large flat process model remains (in our
example there are only two levels).
Figures 13.3 and 13.4 show the limitations of hierarchical decomposition. At the
highest level, one needs to be aware of all interactions at the lower levels. The rea-
son is that higher levels in the decomposition need to be consistent with the lower
levels, e.g., because there is a connection between activity l and activity b at the
lower level, there also needs to be a connection between z and x at the higher level.
This is not only the case for WF-nets, but holds for the hierarchy constructs in other