
Page 346 -
P. 346
328 13 Cartography and Navigation
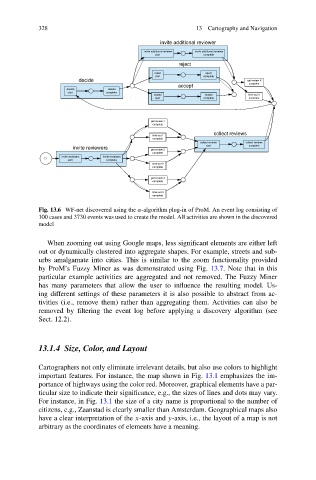
Fig. 13.6 WF-net discovered using the α-algorithm plug-in of ProM. An event log consisting of
100 cases and 3730 events was used to create the model. All activities are shown in the discovered
model
When zooming out using Google maps, less significant elements are either left
out or dynamically clustered into aggregate shapes. For example, streets and sub-
urbs amalgamate into cities. This is similar to the zoom functionality provided
by ProM’s Fuzzy Miner as was demonstrated using Fig. 13.7. Note that in this
particular example activities are aggregated and not removed. The Fuzzy Miner
has many parameters that allow the user to influence the resulting model. Us-
ing different settings of these parameters it is also possible to abstract from ac-
tivities (i.e., remove them) rather than aggregating them. Activities can also be
removed by filtering the event log before applying a discovery algorithm (see
Sect. 12.2).
13.1.4 Size, Color, and Layout
Cartographers not only eliminate irrelevant details, but also use colors to highlight
important features. For instance, the map shown in Fig. 13.1 emphasizes the im-
portance of highways using the color red. Moreover, graphical elements have a par-
ticular size to indicate their significance, e.g., the sizes of lines and dots may vary.
For instance, in Fig. 13.1 the size of a city name is proportional to the number of
citizens, e.g., Zaanstad is clearly smaller than Amsterdam. Geographical maps also
have a clear interpretation of the x-axis and y-axis, i.e., the layout of a map is not
arbitrary as the coordinates of elements have a meaning.