
Page 344 -
P. 344
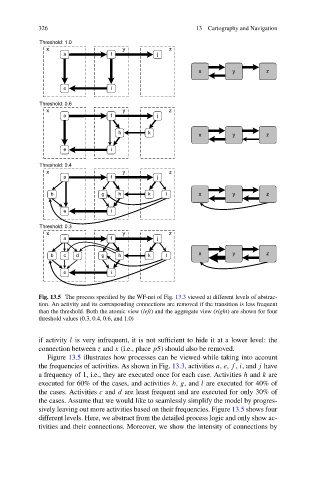
326                                        13  Cartography and Navigation


            Fig. 13.5 The process specified by the WF-net of Fig. 13.3 viewed at different levels of abstrac-
            tion. An activity and its corresponding connections are removed if the transition is less frequent
            than the threshold. Both the atomic view (left) and the aggregate view (right) are shown for four
            threshold values (0.3, 0.4, 0.6, and 1.0)

            if activity l is very infrequent, it is not sufficient to hide it at a lower level: the
            connection between z and x (i.e., place p5) should also be removed.
              Figure 13.5 illustrates how processes can be viewed while taking into account
            the frequencies of activities. As shown in Fig. 13.3, activities a, e, f , i, and j have
            a frequency of 1, i.e., they are executed once for each case. Activities h and k are
            executed for 60% of the cases, and activities b, g, and l are executed for 40% of
            the cases. Activities c and d are least frequent and are executed for only 30% of
            the cases. Assume that we would like to seamlessly simplify the model by progres-
            sively leaving out more activities based on their frequencies. Figure 13.5 shows four
            different levels. Here, we abstract from the detailed process logic and only show ac-
            tivities and their connections. Moreover, we show the intensity of connections by