
Page 100 - Process simulation and control using Aspen
P. 100
92 PROCESS SIMULATION AND CONTROL USING ASPEN1
I mim 1?! r3l-<-lfcl<.UM "-I H _jLH jd JEl
V) - , PlOCBU SUUM j I I
i
. iJ PHI f''V.I fi
, . -1
I
5r .
i
.
i {
CIS-
t
ri t
!
_
Cvitl 'Sack ir i
si y u
- CH
STREWS RYaM TlSitd mt*» SCS?fl BWug BflWch
1« j- 9 -B- «M
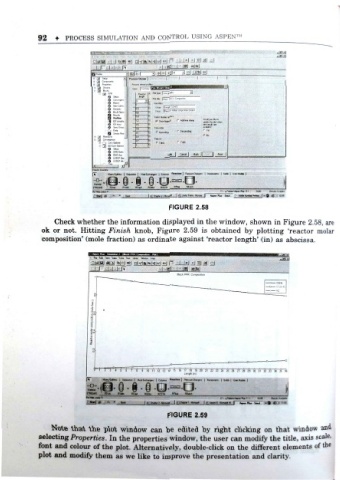
FIGURE 2.58
are
Check whether the information displayed in the window, shown in Figure 2.58 ,
ok or not. Hitting Finish knob. Figure 2.59 is obtained by plotting 'reactor molar
composition (mole fraction) as ordinate against 'reactor length' (in) as abscissa.
'
t- <\<- Dtfa Tooa Put trv . Wnsmr H(*>
Dl lHl am toivj ipi al-nal-KI I"»! Its I M .l lal yj
f
Block PFi Cemmin
| Xnxan. | Sou | u>Mod> |
si u=u
STROIMS RS'jc HTot) Qg RGtfc, ftCSIR ftFy
111 * " ' 8M,
'
.
FIGURE 2.59
Note that the plot window can be edited by right clicking on that window and
selecting Properties . In the properties window , the user can modify the title, axis scale,
font and colour of the plot. Alternatively, double-click on the different elements of the
plot and modify them as we like to improve the presentation and clarity.