Page 98 - Process simulation and control using Aspen
P. 98

90       PROCESS SIMULATION AND CONTROL USING ASPEN

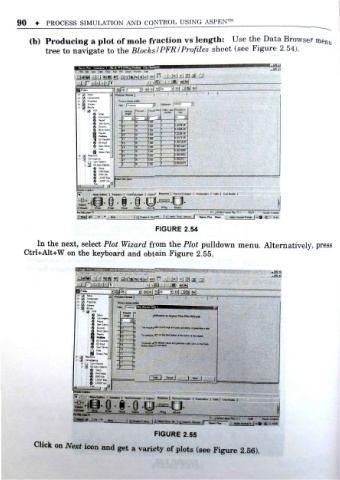
          (b) Producing a plot of mole fraction vs length: Use the Data Browser menu
               tree to navigate to the Blocks IPFRIProfiles sheet (see Figure 2.54).


                       MJi HillLlim-WPMlMli  -.  ..l»1.T71.
                        in Fe &*l V*t C#» Toe* H i PW L*f«7 >  "«
                                    pw
                                      Ltmv
                         t «.
                          Wi
                            V*»
                              C#»
                                  Hji
                                roe*
                        » :
                                t
                        Dloi|y|  I -.1 EelBl  «d H H I"!  li  U
                                 -
                        . ifl      P.OC..I Sbe«. I
                        it  Pt >wt«
                        ft aa 9»um
                           e v.
                        -
                          - a pf
                                         pn  F  z
                                         _
                              Utt Sutra.
                                             far-
                                     bt  !S  iHo
                            f] nwdb      IS         TZZf&VS
                                      ;  15  r?55   sSiTFW "
                                     . 4
                                     s   !5         00001 u*?
                            a 9fM- p«  Z'  5  m -
                        A m RNdm         lb  i55S
                             r
                        -  QniMga    i*  15
                                         IS  last  1  [ri!DK4IIft
                             g LSiQFM,
                        it.    j
                                                             t
                                                          I Maroiao-s | So** ) UtaHvkk |
                                                               C :., a fciJen'j'jsei Pin v
                                               FIGURE 2.54
            In the next, select Plot Wizard from the Plot pulldown menu . Alternatively, press
        Ctrl+Alt+W on the keyboard and obtain Figure 2. 55.
                         a S5
                                                                 I
                                   : PlOCCUtilMnKtXEflM
                         1 a             ft
                                              Wercome ta Aspen Plus Plat WU .rdl
                                         ;
                            9 EM     IJ
                            if/  t** Ocw
                                        j lE
                                         E
                            ft Fa*       ;
                                        ii
                                     24  IE
                                     ir
                                   -
                         9 a EOCor-Ortcm  ;
                            fj  LSSOPBu                 -L  J  J


                           1        i . i y=o
                       51REAMS  1 HSbe  HVMJ  REcU  ROttx


                                              FIGURE 2 .55
           Click on Next icon a
                                nd get a variety of plots (s ee Figure 2.56).
   93   94   95   96   97   98   99   100   101   102   103