
Page 97 - Process simulation and control using Aspen
P. 97
ASPKN PLUS SIMULATION OF REACTOR MODELS 89
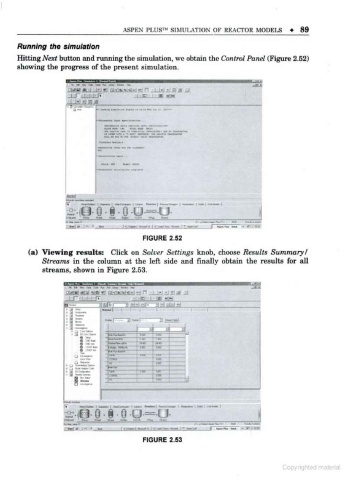
Running the simulation
Hitting Afert button and running the simulation, we obtain the Control Panel (Figure 2.52)
showing the progress of the present simulation.
_i _ r-i I ! ' f» -i-igi 1 w aisd
(0 9 S 8 O = U
M t<< Of*
FIGURE 2.52
(a) Viewing results: Click on Solver Settings knob, choose Results Summary/
Streams in the column at the left side and finally obtain the results for all
streams, shown in Figure 2.53.
I r-i-i -rf7 'i -Hi i in i*l
J
"
a S d
IUWi 1 - m - - tm-1
" "
TW no-
4 1-
- *m -
sub-
aaraocc- - ve- im
(stcsss: -
rwm 1
L
ROT Ml
Mr
-
oi
TWI
M
I - I M»l
inuA mm mm mik --
-I * I-
FIGURE 2.53
C ll