
Page 155 - Process simulation and control using Aspen
P. 155
142 4 PROCESS SIMULATION AND CONTROL USING ASPEN
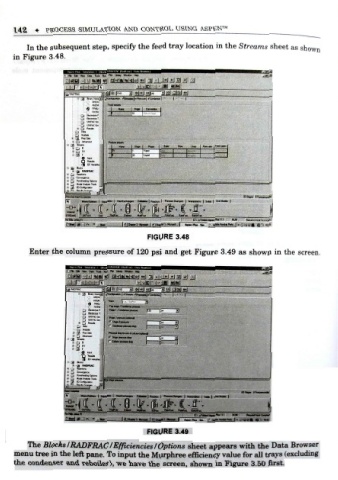
In the subsequent step, specify the feed tray location in the Streams sheet as shown
in Figure 3.48.
fl. Ml D«i T«* ft* PW Uom* VMcm N*
I
CJ
. 31 P«p 3«.
Q
flow
i rj dv
20 Um4
S .
t . .
9 , '
0- RADFRAC
Hi j j flndxa r
* Cj T3<*
SinDWS ! OSTW OiW ft K tm*t MJJ.tc Sgt*e fWuc Hwfi»e B*<(W-<«
.
FIGURE 3.48
Enter the coliunn pressure of 120 psi and get Figure 3.49 as shown in the screen.
-1*1 xl
: f--3
5* pfboi
Cj b**<**t
Ci 'jruJACCw
f
Cj uwf«&o
t cj «~*
Cj
E ( J Vt. j xr-
* CJ .
cj w
_ CJ fearfiMngCkUn
!-
'
f*M* Mfr
FIGURE 3.49
The Blocks/RADFRAC/Efficiencies/Options sheet appears with the Data Browser
f
menu tree in the left pane. To input the Murphree eficiency value for all trays (excluding
the condenser and reboiler) we have the screen, shown in Figure 3.50 first.
,