
Page 158 - Process simulation and control using Aspen
P. 158
ASPEN PLUS SINfULATION OF DISTILLATION MODELS 145
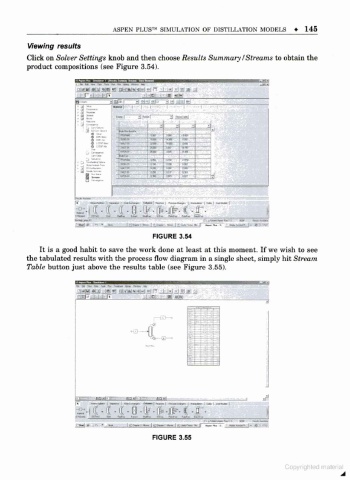
Viewing results
Click on Solver Settings knob and then choose Results Summary /Streams to obtain the
product compositions (see Figure 3.54).
r-i .i.i>fv - jci
rl 3'-f 13 "--l
9 J
_
IM Mi
mmf ~ " Hi 1 " T» TBH
«.>* " TOB 1 l» . "
| 1 J
»*». - sin 1 " rtai-' -
Will ue in 1 !
TariT ' «« IM
lb i«»
i . «
"
aoni IJH- TIB TM
ntn 1 . a l<» III
Tf«5B 1
f» n hi 1 i I wr mi "in 1 « » hihi I "i |
| <u« reWj M M« C-» Mta ti>« rmt» Km*~
-
.rw » -.«»«* I- .> '..
FIGURE 3.54
It is a good habit to save the work done at least at this moment. If we wish to see
the tabulated results with the process flow diagram in a single sheet, simply hit Stream
Table button just above the results table (see Figure 3.55).
JMMI .til _!.) a nH-|»l%l<M ») r I i-l .IglJi £j
lisf i - i -id urn
«-C3-
FIGURE 3.55